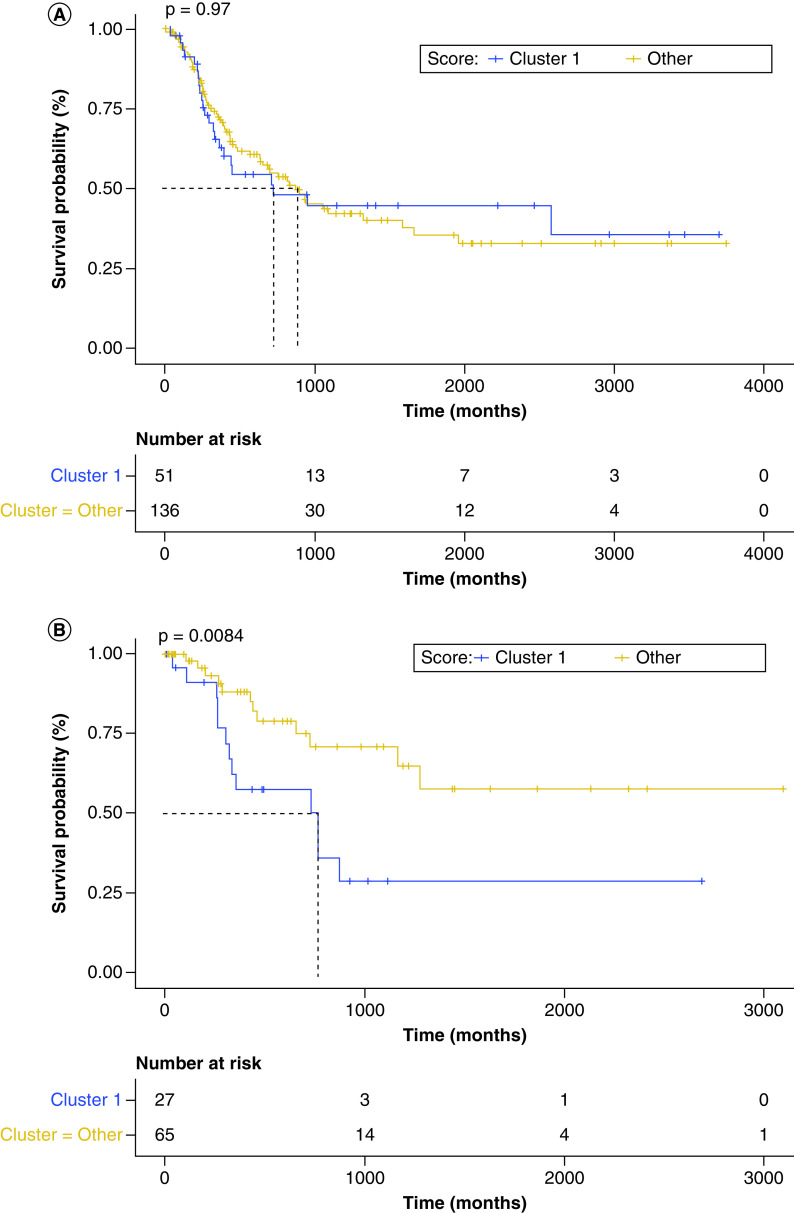
Figure 3. . Survival differences between clusters.
(A) Kaplan–Meier curve displaying overall survival, which demonstrates no difference between cluster 1 (L:Mlow and M0-enriched) and the remaining clusters (grouped) for patients in whom the tissue site sequenced was a distant metastasis or regional lymph node (HR: 0.9919; 95% CI: 0.6145–1.601; p = 0.974). (B) Kaplan–Meier curve displaying overall survival, which demonstrates a significant difference between cluster 1 (L:Mlow and M0-enriched) and the remaining clusters (grouped) for patients in whom the tissue site sequenced was a distant metastasis or regional lymph node. Cluster 1 demonstrated a poorer prognosis (HR: 2.804; 95% CI: 1.262–6.234; p = 0.0114).
LM: Lymphocyte-to-monocyte.

