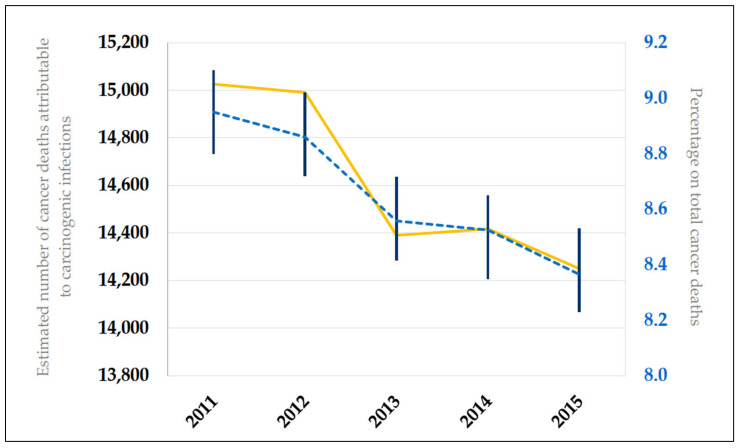
Figure 1.
Time-series of cancer mortality burden attributable to carcinogenic infections over a 5-year period (2011–2015) in Italy. The yellow line represents the estimated numbers of cancer deaths attributable to carcinogenic infections; the dashed blue line identifies the percentage of the total cancer deaths, with 95% confidence intervals (vertical lines).

