Figure 4.

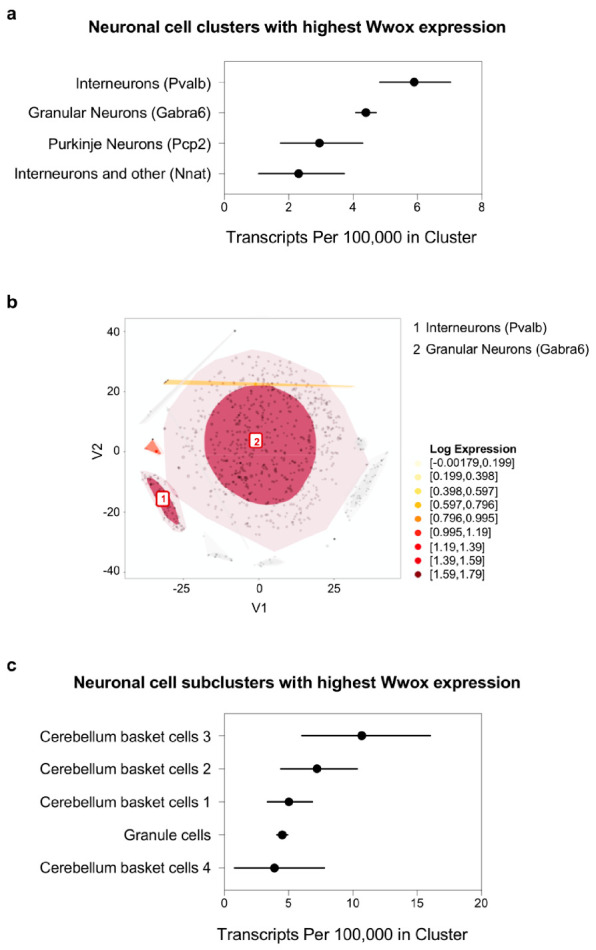
Wwox expression at single-cell level in mouse cerebellum neurons. (a) Graph representing neuronal cell clusters. Pvalb+ interneurons and Gabra6+ granule cells express the most Wwox transcripts in mouse cerebellum. Markers specific to each cell cluster are shown in parenthesis. (b) t-SNE plot highlights the top two clusters described in (a) as the darkest colored regions among cerebellum cells. (c) Graph representing specific neuronal subclusters expressing the most Wwox transcripts. GABAergic basket cells (i.e., interneurons) and granular neurons are the top cell types. The confidence intervals in graphs (a,c) reflect statistical sampling noise calculated from the binomial distribution and reflecting the total number of unique molecular identifier (UMIs) ascertained by cluster rather than cell-to-cell heterogeneity within a cluster. Data was obtained from the mouse brain single-cell RNA sequencing (scRNA-seq) DropViz database (http://dropviz.org/) [28].
