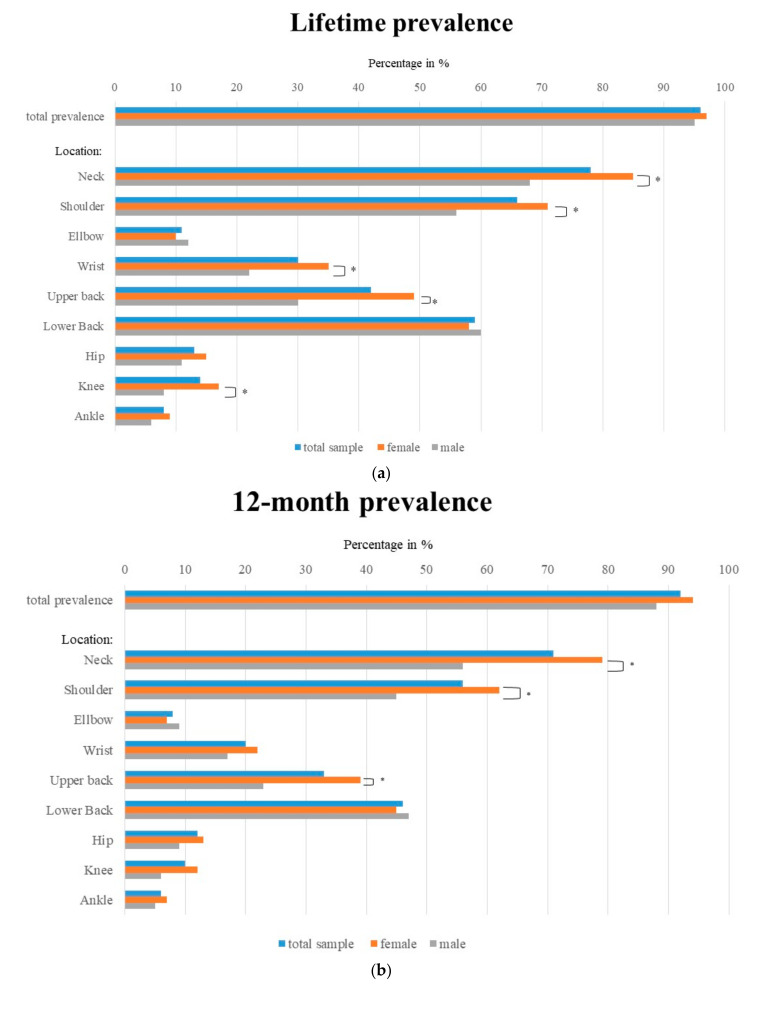
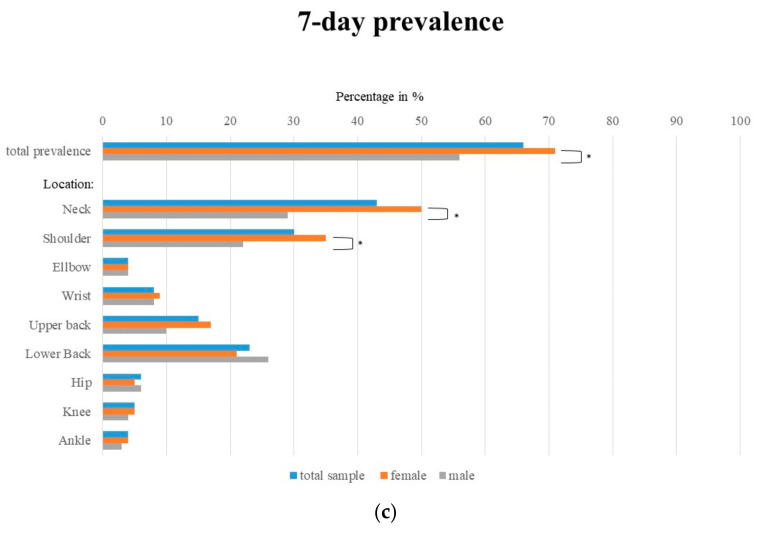
Figure 2.
(a) Distribution of musculoskeletal disorder (MSD) among all participants (n = 450), female participants (n = 287) and male participants over lifetime. (b) Distribution of MSD among all participants (n = 450), female participants (n = 287) and male participants for 12-month prevalence. (c) Distribution of MSD among all participants (n = 450), female participants (n = 287) and male participants for 7-day prevalence. * means p < 0.05.


