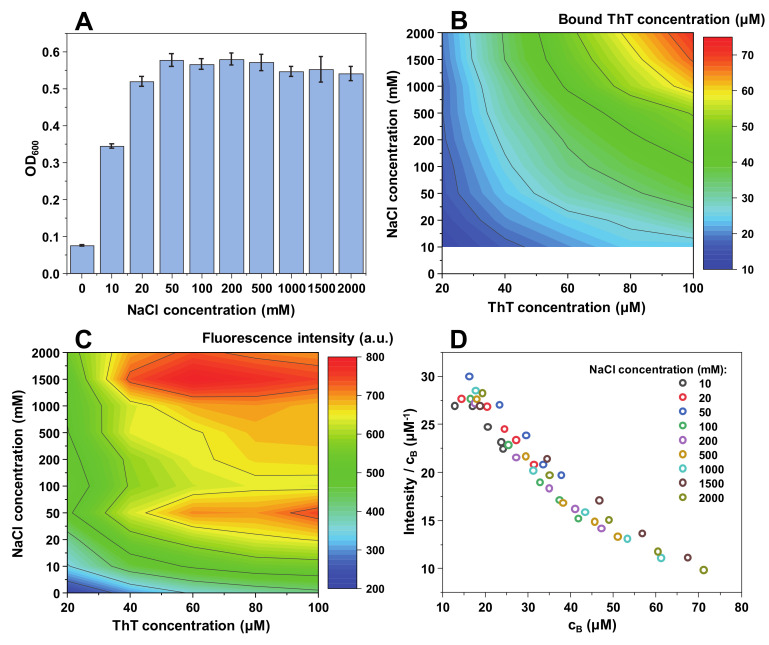
Figure 2.
Lysozyme fibril and ThT solution optical density at 600 nm (A), bound ThT concentration (B), intensity/bound ThT (I/cB) ratio (C) and fluorescence intensity (D) at different NaCl concentrations. Optical density and fluorescence spectra intensities are the result of three repeats. The white area in the bound ThT graph (B) represents conditions under which bound ThT concentration could not be determined accurately. Fluorescence intensity values are corrected for the primary and secondary inner filter effects.

