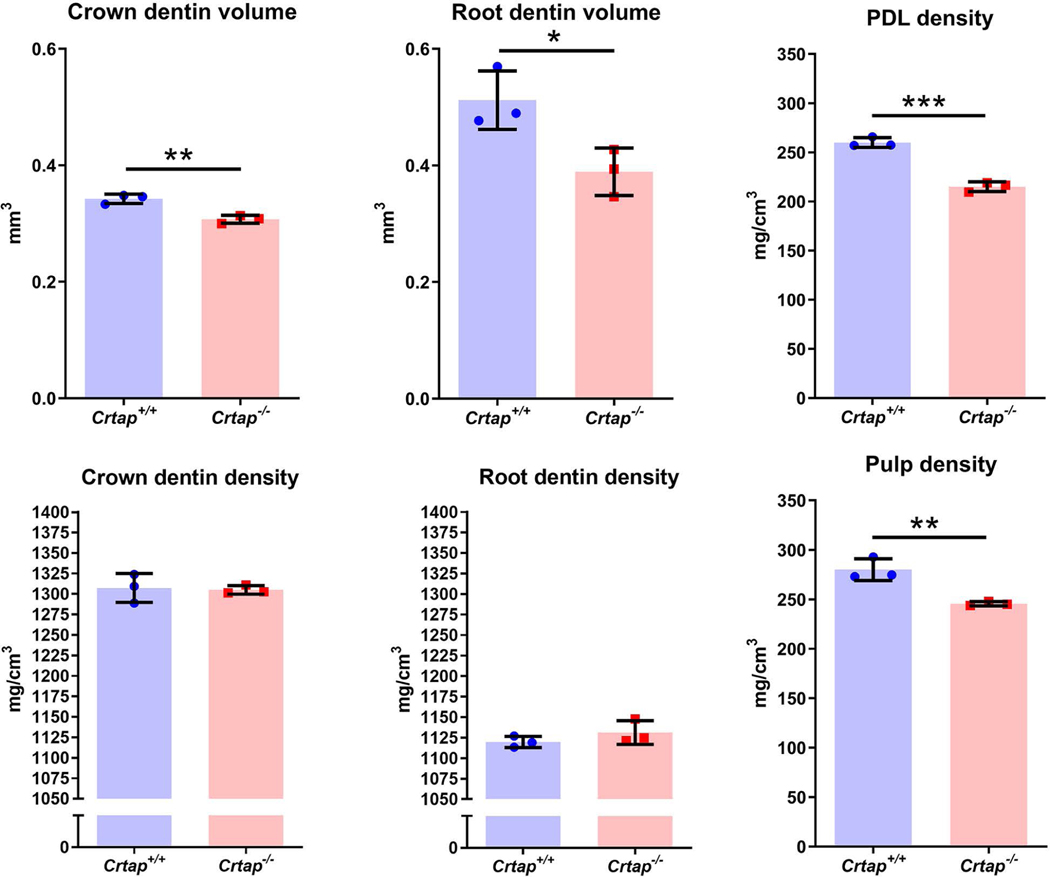
Figure 4. Altered Dentin, Pulp, and PDL in Crtap−/− Mice.
Quantification of micro-CT reveals that compared to Crtap+/+ controls (n=3 per genotype at 2 months). Crtap−/− mice feature significantly decreased crown and root molar dentin volumes, while mineral density was different in neither. Both pulp and PDL densities were reduced in Crtap−/− vs. control mice. *p < 0.05; ** p < 0.01, ***p<.005 between genotypes.

