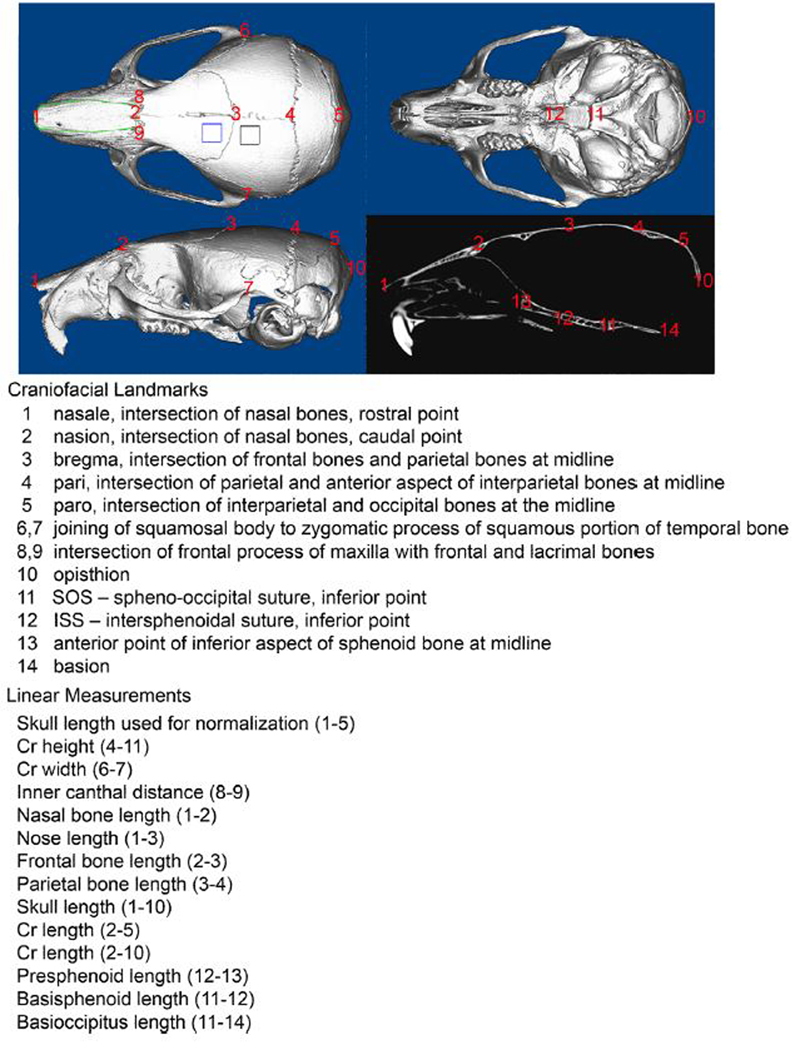
Figure 7. Craniofacial Landmarks and Linear Distances.
3D landmarks placed on micro CT images of skulls to compare the craniofacial shape of Crtap−/− mice and wild type littermates. Micro-CT regions of interest for the parietal bone is outlined in black on axial image; Regions of interest for the frontal bone is outlined in blue on axial image; Regions of interest for the nasal bone is outlined in green on axial image. These regions of interest are custom splined to extend only enough to include the entire bone thickness, as described in experimental procedures.

