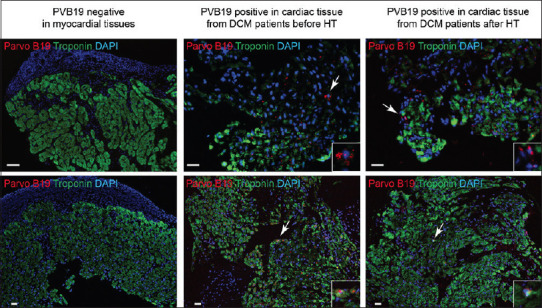
Figure 2.

Representative images showing immunofluorescence analysis of PVB19 in PVB19 negative (control group), and positive PVB19 in cardiac tissue from dilated cardiomyopathy patient and myocardial biopsy samples from cardiac allograft after heart transplantation in the same patient. Troponin (green) staining was used as a control for cardiac tissue-specific staining. PVB19 positive areas (red) are indicated with white arrowhead. Expanded images of PVB19 positive staining are shown within white boxes wherever necessary. The scale bar represents 10 μm
