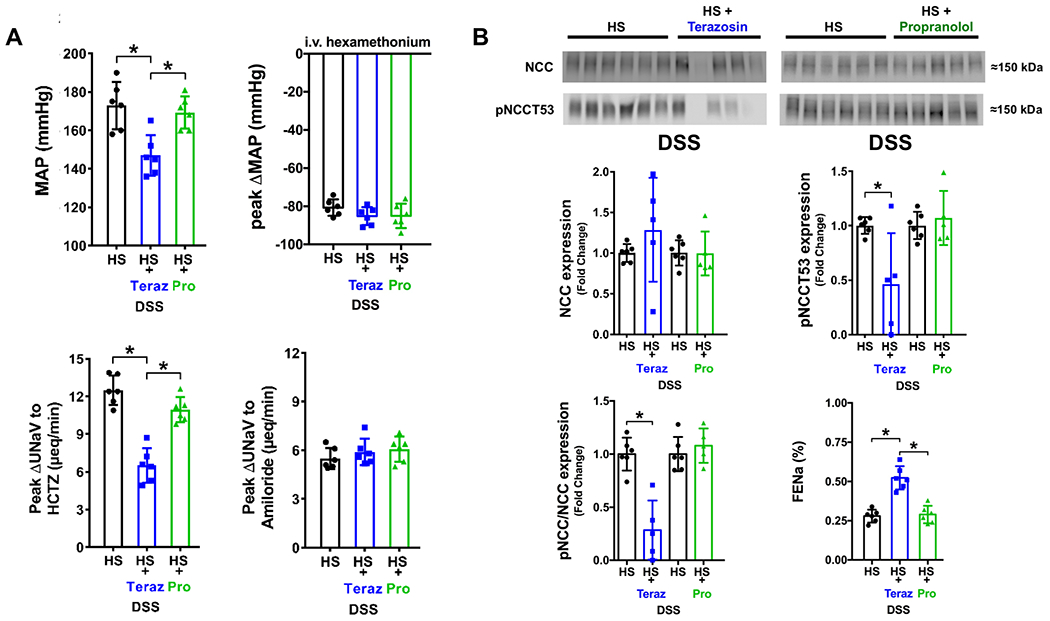
Figure 3. Impact of chronic adrenoceptor antagonism on the development of Dahl Salt-Sensitive (DSS) hypertension.

(A) Mean arterial pressure (MAP; mmHg), peak ΔMAP (mmHg) in response to i.v. hexamethonium (30 mg/kg), in vivo NCC activity expressed as peak natriuretic response (ΔUNaV) to intravenous hydrochlorothiazide (HCTZ; 2 mg/kg bolus, 2 mg/kg hour infusion), in vivo ENaC activity expressed as peak ΔUNaV to intravenous amiloride (2 mg/kg bolus, 2 mg/kg hour infusion); (B) representative immunoblots for NCC, pNCCT53 and total NCC expression, pNCCT53 expression, pNCC/NCC ratio and FENa (%) in groups of 3-month old male untreated DSS rats or groups of DSS rats that received a subcutaneous (s.c.) infusion of saline/DMSO vehicle terazosin (Teraz) or propranolol (Pro) dissolved in saline/DMSO during a 21-day HS diet. N=5/6 per group mean ± SD. Treatment group protein expression was compared to the same untreated HS group expression via individual blots to avoid comparing separate immunoblots. MAP = mean arterial pressure, UNaV = urinary sodium excretion, FENa = Fractional Excretion of Sodium. Protein expression is shown as fold change with untreated DSS HS target protein expression for each individual blot set to 1. Differences in peak natriuretic responses and MAP were determined using a one-way ANOVA to assess differences between groups, and a Tukey post-hoc test was used to evaluate variation among groups. Differences in untreated DSS HS and HS + adrenoceptor antagonist target protein expression were determined using a student’s t test. *P < 0.05 vs. respective DSS HS group.
