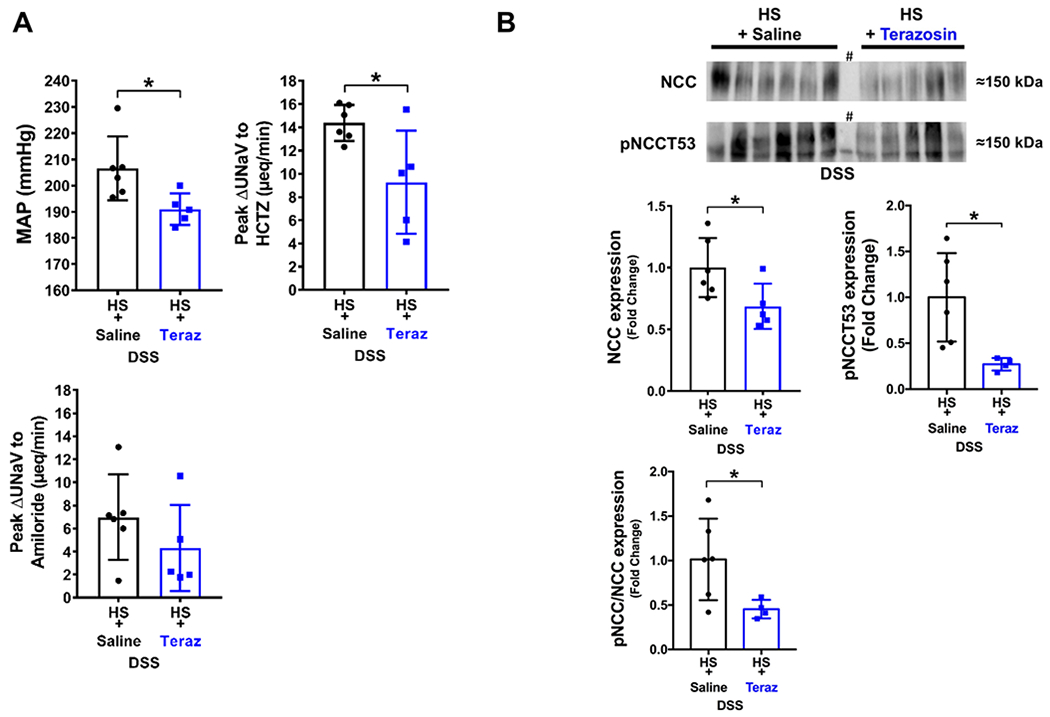
Figure 5. Impact of chronic α1-adrenoceptor antagonism on established Dahl Salt-Sensitive (DSS) hypertension.

(A) Mean arterial pressure (MAP; mmHg), in vivo NCC activity expressed as peak natriuretic response (ΔUNaV) to intravenous hydrochlorothiazide (HCTZ; 2 mg/kg bolus, 2 mg/kg hour infusion), in vivo ENaC activity expressed as peak ΔUNaV to intravenous amiloride (2 mg/kg bolus, 2 mg/kg hour infusion); (B) representative immunoblots for NCC, pNCCT53 and total NCC expression, pNCCT53 expression and pNCC/total NCC ratio in groups of DSS rats fed a 42-day high salt (HS, 4% NaCl) diet that received a subcutaneous (s.c.) infusion of saline/DMSO or terazosin/DMSO during days 21-42 of the 42-day HS diet. N=5/6 per group mean ± SD. MAP = mean arterial pressure, UNaV = urinary sodium excretion. Protein expression is shown as fold change with HS + saline target protein expression set to 1. Differences between treatment groups were determined using a student’s t test, *P < 0.05 vs. saline group. # lane was not considered in quantification.
