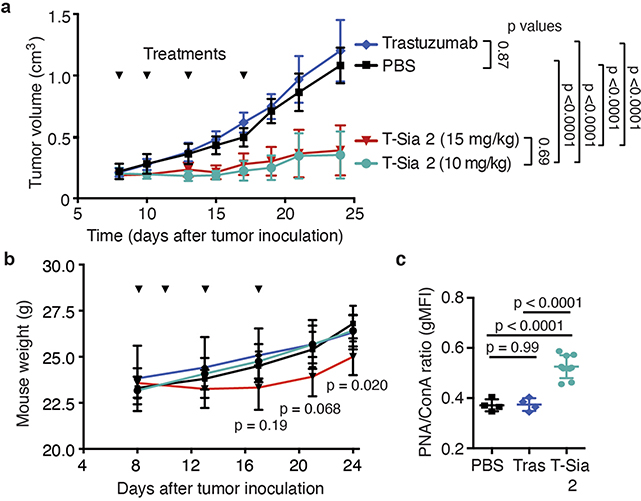
Extended Data Fig. 4 |. T-Sia 2 treatment desialylates EMT6 tumors and delays tumor growth compared to trastuzumab- or PBS-treatment.
a, Mean ± SD tumor volume over time for HER2+ EMT6 tumor-bearing mice described in Fig. 4b, treated with PBS (n = 5), trastuzumab (10 mg/kg injection, n = 6), T-Sia 2 (10 mg/kg injection, n = 6), and T-Sia 2 (15 mg/kg injection, n = 6). RM two-way ANOVA with adjusted p-values from Tukey’s multiple comparisons between groups shown. b, Mouse weight from all of the mice in (a) measured 5x over the course of 24 days of treatment and tumor growth. Ordinary two-way ANOVA with Dunnet’s multiple comparisons to PBS mice, multiplicity-adjusted p-values for T-Sia (15 mg/kg) compared to PBS are shown at three time points, (mean ± SD). c, Lectin flow cytometry staining with fluorescent PNA to detect exposed galactose of extracted tumor cells from mice in Fig. 4b upon their sacrifice 13–23 days after final administration of PBS, trastuzumab, or T-Sia 2, (geometric mean (gMFI) ± SD), normalized to ConA fluorescence (a control that binds to mannose on cells), n = 4 (trastuzumab, PBS) n = 9 (T-Sia 2). Ordinary one-way ANOVA with adjusted p-values shown from Tukey’s multiple comparisons.

