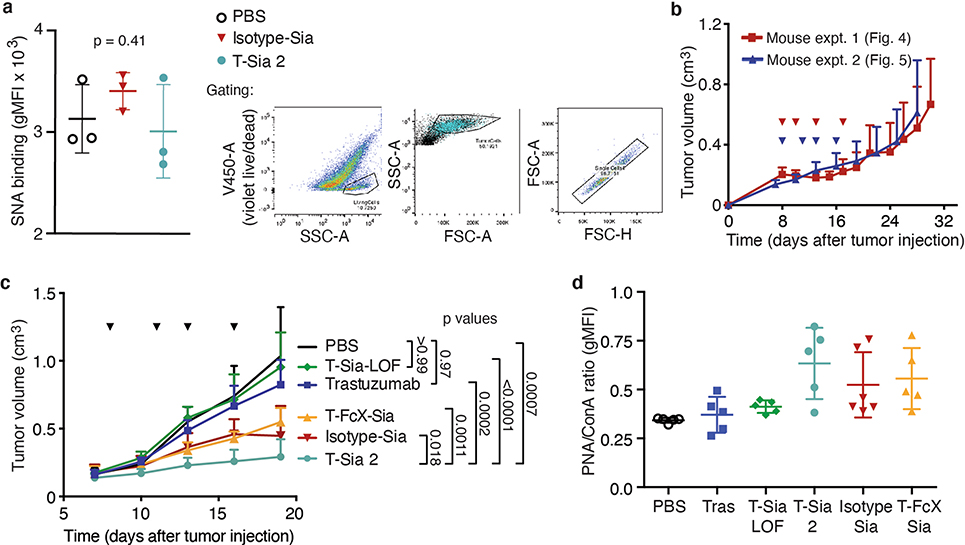
Extended Data Fig. 7 |. Testing the control sialidase-conjugates against the HER2+ EMT6 tumor model.
For flow cytometry analysis of sialoglycan degradation, a single 20 pmol injection of T-Sia 2, Isotype-Sia, or PBS control was injected IP into mice with subcutaneous HER2+ EMT6 cells. After four days, tumors were harvested. a, Staining with Sambucus nigra (Elderberry Bark) lectin (SNA), which preferentially binds sialic acid in an (α-2,6) linkage, did not show significant desialylation changes between these samples, n = 3 mice, geometric mean ± SD. Right: gating strategy: dead cells and tumor debris were gated out (V450-A-/SSC-A), followed by gating on size (FSC-A/SSC-A - *blue cells depict where HER2+ stained cells fall in the gate). Finally, single cells are gated with FSC-A/FSC-H. b, Growth curves of the HER2+ EMT6 tumors of mice treated with T-Sia 2 (10 mg/kg) were consistent between the first tumor growth mouse experiment (shown in red, depicted in Fig. 4c, n = 6 mice) and the second independent experiment (blue, depicted in Fig. 5d, n = 7 mice); data are reported as mean ± SD. c. Average (mean + SD) tumor growth of all the mice in Fig. 5d plotted together until the first mouse death (day 19). Mice were injected IP with PBS (n = 6), 10 mg/kg trastuzumab (tras) (n = 6), T-Sia-LOF (n = 6), Isotype-Sia (n = 6), T-FcX-Sia (n = 7), or T-Sia 2 (n = 7). A two-way ANOVA was performed with adjusted p-values from Tukey’s multiple comparisons. d, Lectin stain with PNA of exposed galactose from extracted tumor cells taken from the mice in Fig. 5d, e after mouse sacrifice. Geometric mean ± SD of PNA/ConA, (n = 5: PBS, Tras, T-Sia-LOF, T-FcX-Sia; n = 6: Isotype-Sia).

