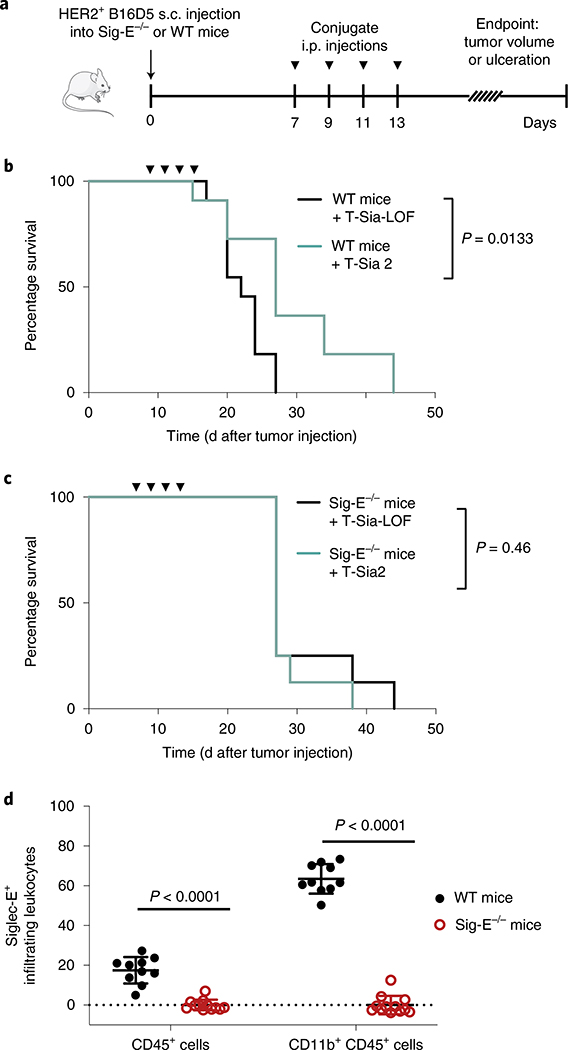
Fig. 6 |. T-Sia 2 therapy is dependent on functional Siglec-E, a receptor highly expressed on tumor-infiltrating myeloid cells.
a–c, HER2+ B16D5 cells were injected s.c. (a) into either WT C57BL/6 mice (b) or Sig-E−/− C57BL/6 mice (c). Mice were injected four times i.p. with 10 mg kg−1 T-Sia 2 (n = 11 WT, n = 8 Sig-E−/−) or the inactive T-Sia-LOF (n = 11 WT, n = 8 Sig-E−/−). Survival curves are displayed indicating when euthanasia criteria were reached, P values are shown from a log-rank (Mantel–Cox) test. Data are from n = 2 independent mouse experiments and individual growth curves are reported in Extended Data Fig. 9. d, Percentage of tumor-infiltrating leukocytes (CD45+) and myeloid cells (CD11b+ of CD45+) that are Siglec-E+ by flow cytometry with background staining subtracted. Mean values ± s.d. are reported along with multiplicity-adjusted P values from two-tailed t-tests with the Holm–Sidak correction at α = 0.05 from n = 10 WT mice and n = 12 Sig-E−/− mice. Myeloid cells (CD11b+) can include macrophages, dendritic cells, monocytes and granulocytes.

