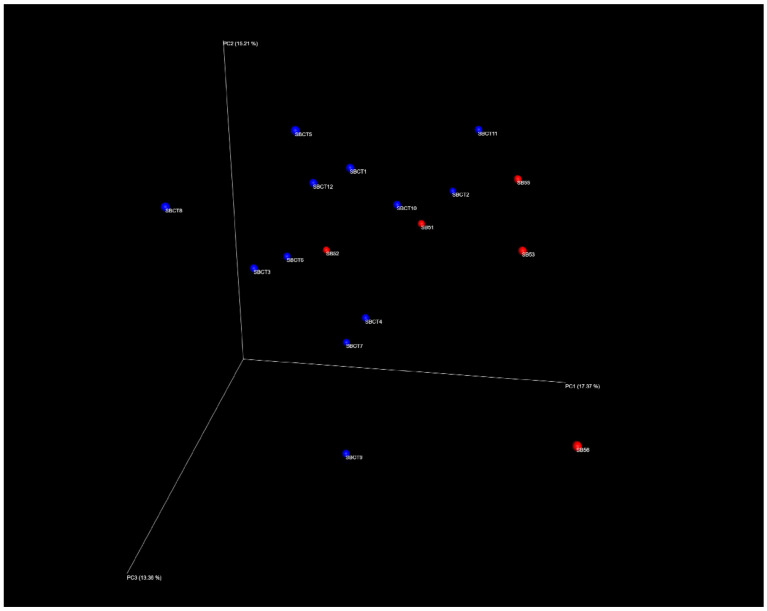
Figure 1.
Principal Coordinate Analysis (PCoA) plot showing the differences in the microbiota composition of each fecal sample (inter-individual variability) on three-dimension axes. Each dot corresponds to the unique composition of a single fecal sample. The distance between dots represents the degree of variability of the microbiota composition among samples. Samples from sarcopenic subjects (n = 5) are indicated in red and samples from control subjects (n = 12) are indicated in blue. No statistically significant clusters could be identified through PERMANOVA and ANOSIM tests.

