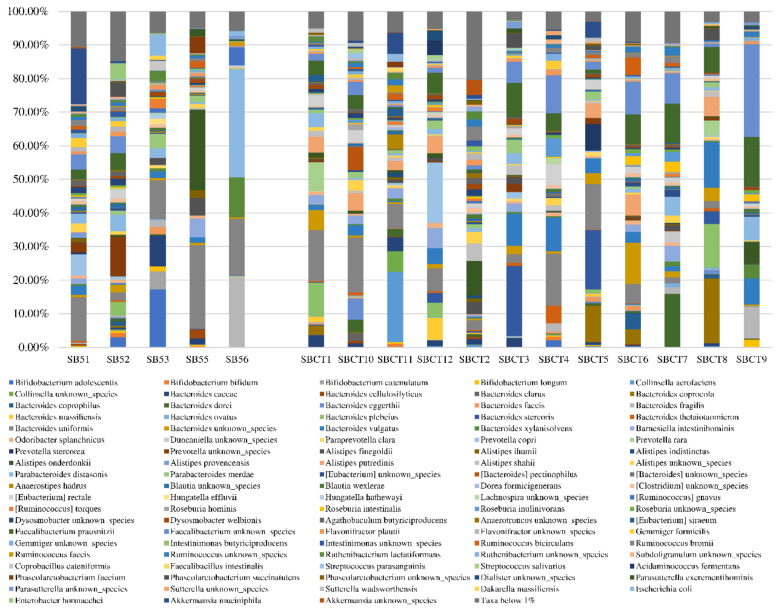
Figure 2.
Graphical representation of the fecal microbiota composition, assessed by shotgun metagenomics sequencing, of five older subjects with primary sarcopenia (left) and 12 non-sarcopenic controls (right). Only species with a relative abundance >1% in at least one sample are included in this graphical representation.

