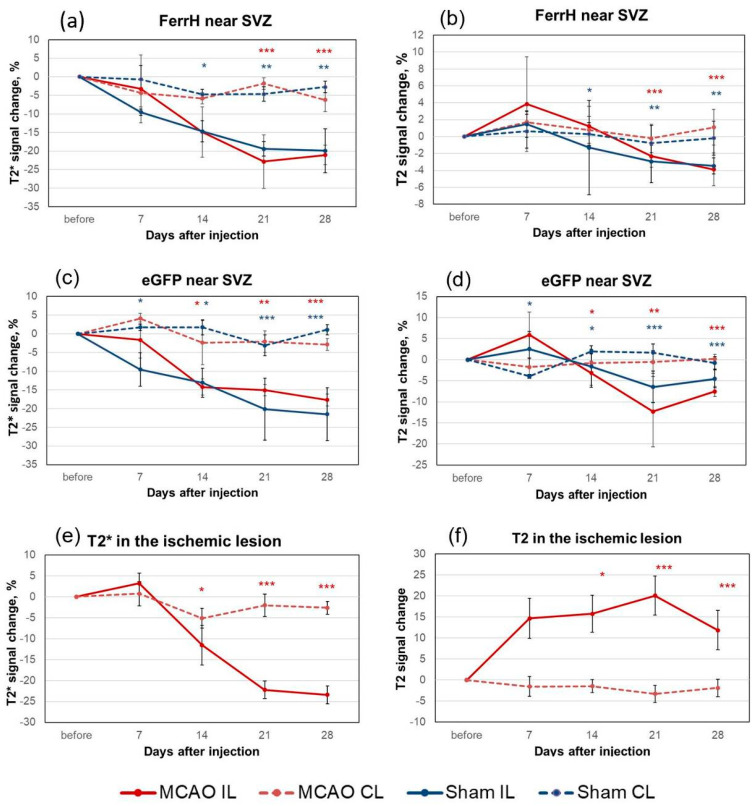
Figure 3.
Quantification of the MRI signal in the zones of hypointensity on T2*- and T2-weighted images on different days after injection of AAV-pDCX-FerrH and AAV-pDCX-eGFP. (a,b) Percentage change of signal hypointensity near the SVZ on T2*- (a) and T2-weighted (b) images before and after AAV-pDCX-FerrH injection. Numbers are shown relative to the baseline (before MCAO or sham operation). (c,d) Percentage change of signal hypointensity near the SVZ on T2*- (c) and T2-weighted (d) images before and after AAV-pDCX-eGFP injection. (e,f) Percentage change of signal hypointensity areas in the ischemic lesion (FerrH and eGFP groups combined). Statistically significant differences in MRI signal change between ipsilateral and contralateral hemispheres were marked with stars (*), according to ANOVA after LSD’s correction for multiple comparisons: * p < 0.05; ** p < 0.01; *** p < 0.001. Abbreviations: MCAO, middle-cerebral-artery-occlusion; AAV, adeno-associated viral backbone; pDCX, doublecortin promoter; FerrH, ferritin heavy chain; eGFP, enhanced green fluorescent protein; SVZ, subventricular zone; IL, ipsilateral; CL, contralateral.

