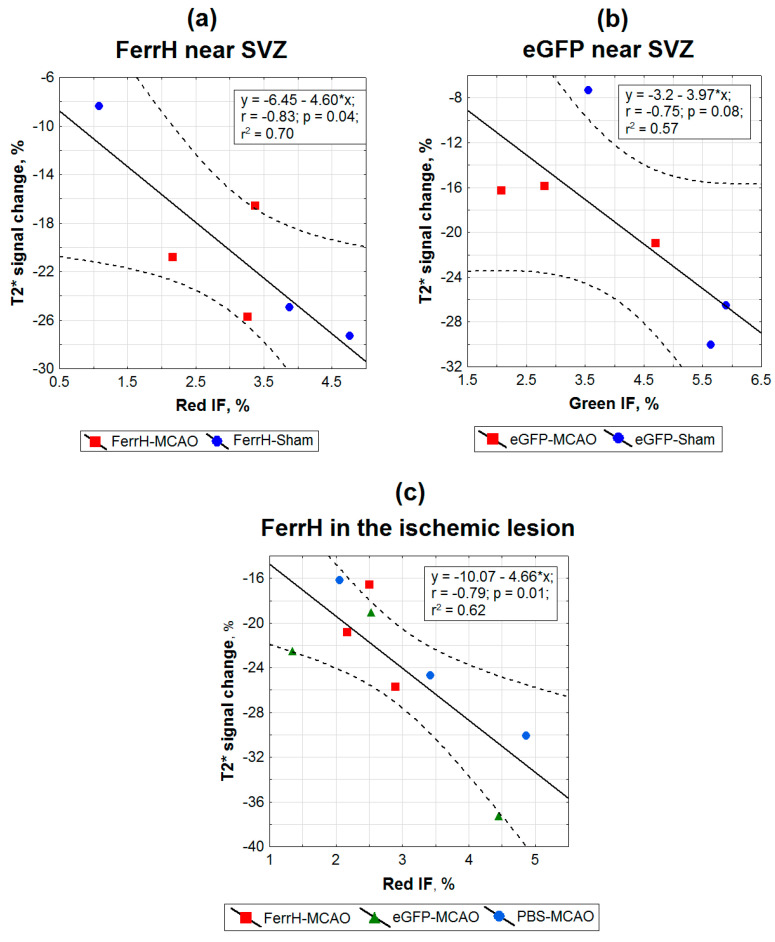
Figure 5.
Histological validation of the MRI signal hypointensity areas at day 28 after AAV-pDCX-FerrH, AAV-pDCX-eGFP, or PBS with fluorescent images of eGFP signal, FerrH-, and CD68-stained brain sections. Panels (a–c) show linear regression plots of the percentage changes in T2* signal hypointensity relative to the baseline point as in the ischemic lesion relative to the symmetric contralateral anatomical region as a function of (a) FerrH IF in the zone near the SVZ, (b) eGFP IF in the zone near the SVZ, and (c) FerrH IF in the ischemic lesion. Points represent color-coded individual data for the animals from different groups. Abbreviations: MCAO, middle-cerebral-artery occlusion; AAV, adeno-associated viral backbone; pDCX, doublecortin promoter; FerrH, ferritin heavy chain; eGFP, enhanced green fluorescent protein; PBS, phosphate-buffered saline; SVZ, subventricular zone; red IF, intensity of red channel immunofluorescence in micrographs; green IF, intensity of green channel immunofluorescence in micrographs.

