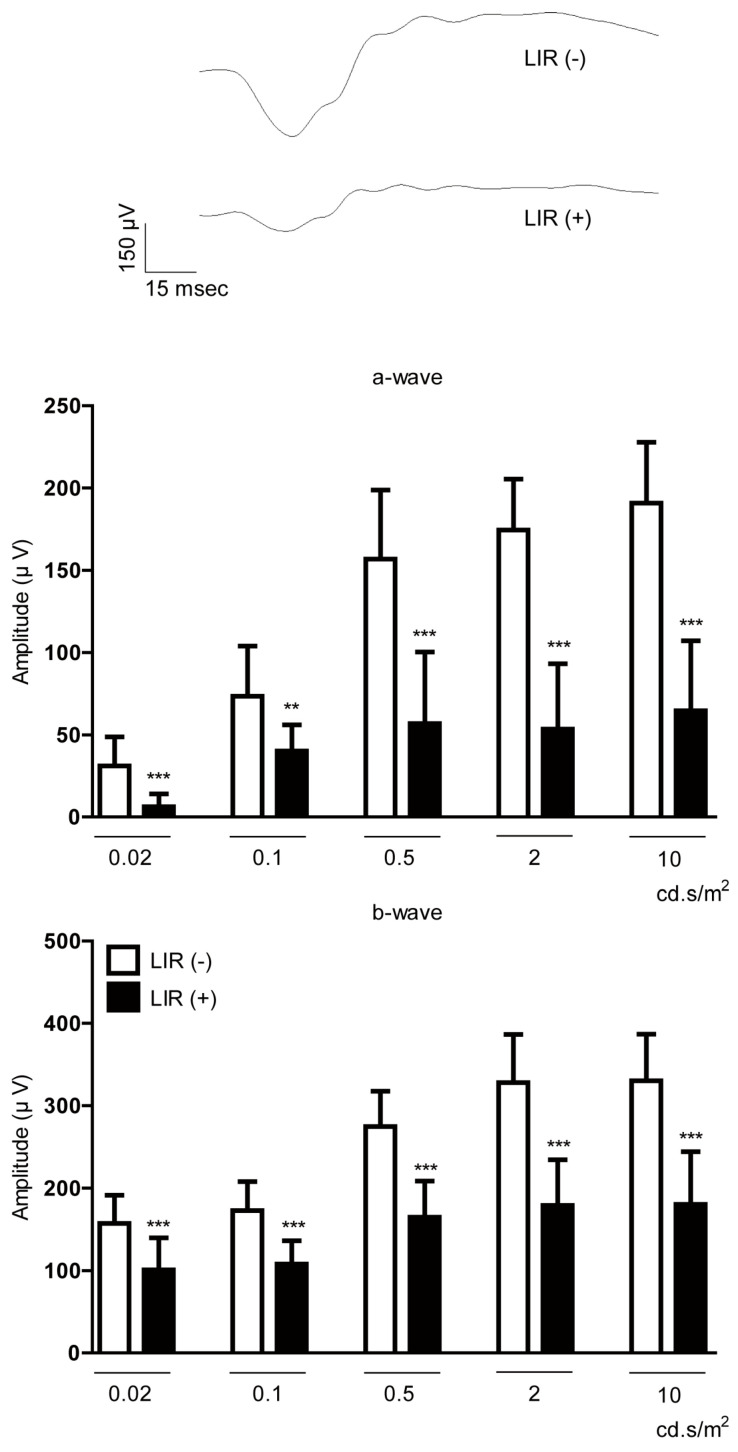
Figure A6.
Evaluation of a mouse model of LIR. Representative waveforms of a- and b-waves (2 cd.s/m2) and quantitative analyses showed that the light exposure (3000 lux) significantly decreased the amplitudes of a-wave and b-wave in the retina (n = 6 per group, 12 eyeballs per group). ** p < 0.01, *** p < 0.001. Bar graphs were presented as mean ± standard deviation. The data were analyzed using Student’s t-test.

