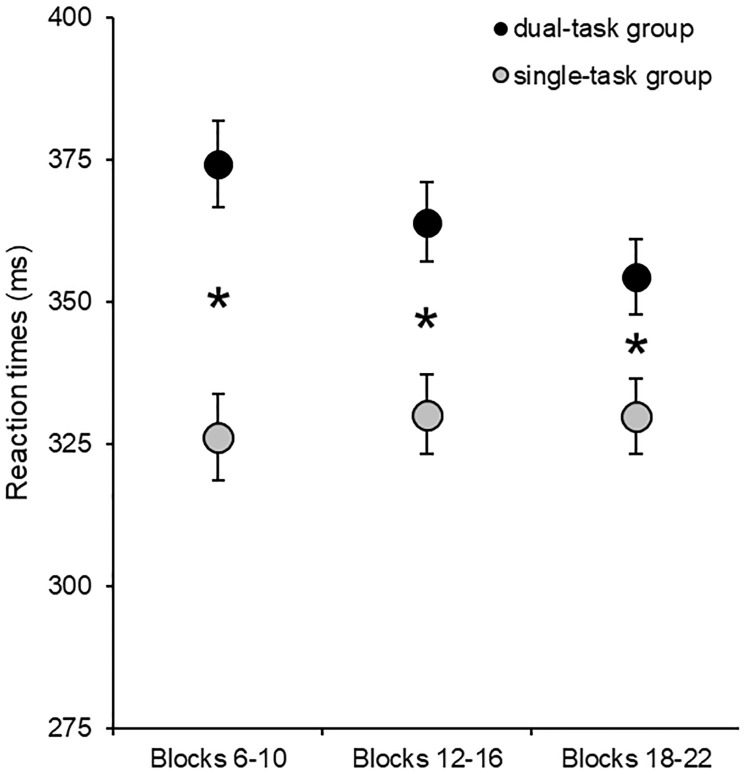
Fig 4. Overall RTs in the test blocks.
The horizontal axis represents the three units of test blocks, and the vertical axis the average RTs. The error bars signal the standard error of the mean. Participants were faster in the test blocks in the single-task group, revealing that the dual-task affected the average RTs. *: p < .05.

