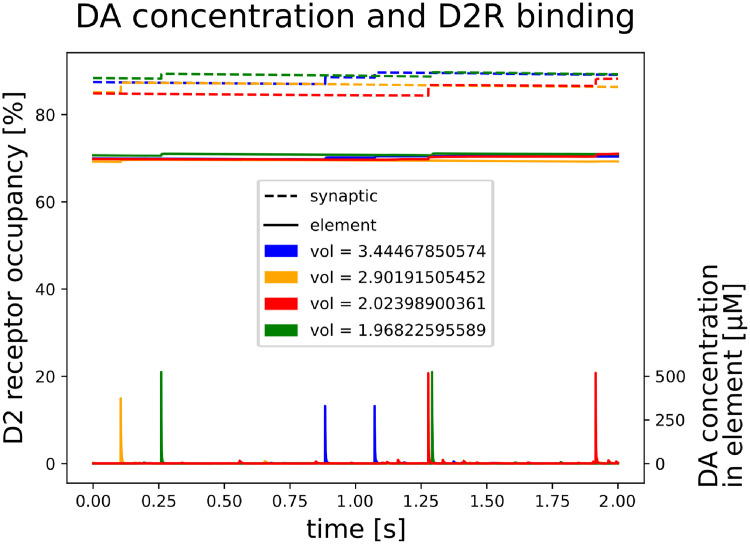
Fig 6. Extra-synaptic DA.
DA concentration and D2R binding characteristics for four randomly chosen finite elements containing a synaptic terminal. Depicted at the bottom is DA concentration within the finite element of the tonic model, i.e. extra-synaptic DA concentration within a radius of ~ 0.8μM from the terminal. Large concentration peaks indicate DA release from this synapse, while smaller peaks are caused by DA release from neighboring terminals. As the same amount of DA molecules is released every time, peak concentration in larger volumes (coarser resolutions) are smaller. The upper (dotted lines) and middle graphs (solid lines) illustrate slow D2R binding in a short time window for the SRS in synaptic (dotted) and peri-synaptic (solid) space.

