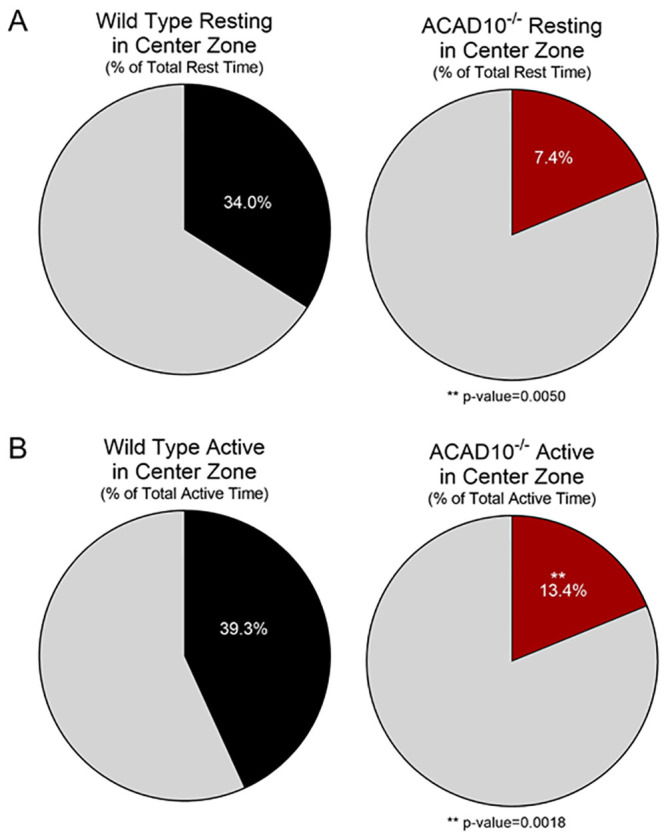
Fig 5. Temporal distribution of activities in the open field test by wildtype and Acad10-deficient mice.

(A-B) Group averages of the percent of total rest time or percent of total active time spent in the center (colored segments) versus the surround (grey segments) of the the open field arena for wild-type mice (black) and Acad10-deficient (red) mice. Of the total amount of time mice rested (A) or were active (i.e., engaged in locomotion, rearing, or movements while stationary; B), the percent of time mice did so in the center of the test arena was statistically significantly lower for Acad10-deficient mice compared to wild-type mice of the same background (unpaired Student’s T-test with Welch’s correction, p-value <0.05).
