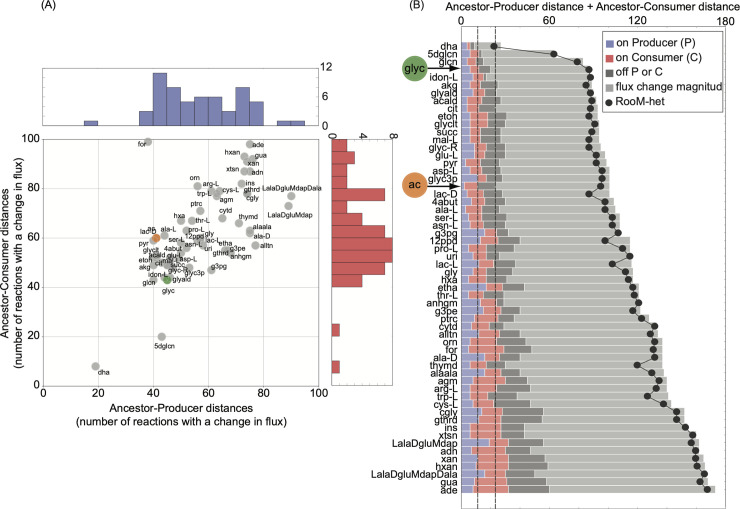
Fig 2. Metabolic distance between the ancestor and cross-feeding strains.
(A) The ancestor-producer and ancestor-consumer distances (measured as the number of reactions requiring a flux change) obtained when performing RooM are given on the x- and y- axes respectively. Every circle in the plot corresponds to one metabolite with cross-feeding potential. Acetate and glycerol are shown as orange and green circles respectively. The diagonal line is shown as a visual guide. A circle on the line indicates that the same number of reactions needs to change their flux to create the corresponding producer and consumer strain. Blue and red histograms show the distribution of the ancestor-producer and ancestor-consumer distances, respectively. (B) The y-axis shows acronyms for the 58 metabolites that can lead to stable cross-feeding interactions, ranked according to decreasing probability of evolving cross-feeding, as quantified by the total RooM-predicted distance (sum of ancestor-producer and ancestor-consumer distances) shown on the x-axis. Different bar colors indicate the number of reactions classified as turned ‘on’ in the producer relative to the ancestor (blue), turned ‘on’ in the consumer relative to the ancestor (red), turned ‘off’ in either the producer or consumer relative to the ancestor (dark grey), as well as reactions requiring a flux change in either producer or consumer relative to the ancestor (‘flux change magnitude’, in light grey). Black circles show the total distances obtained when we used RooM-het (explained in the following section) to minimize strain distances.

