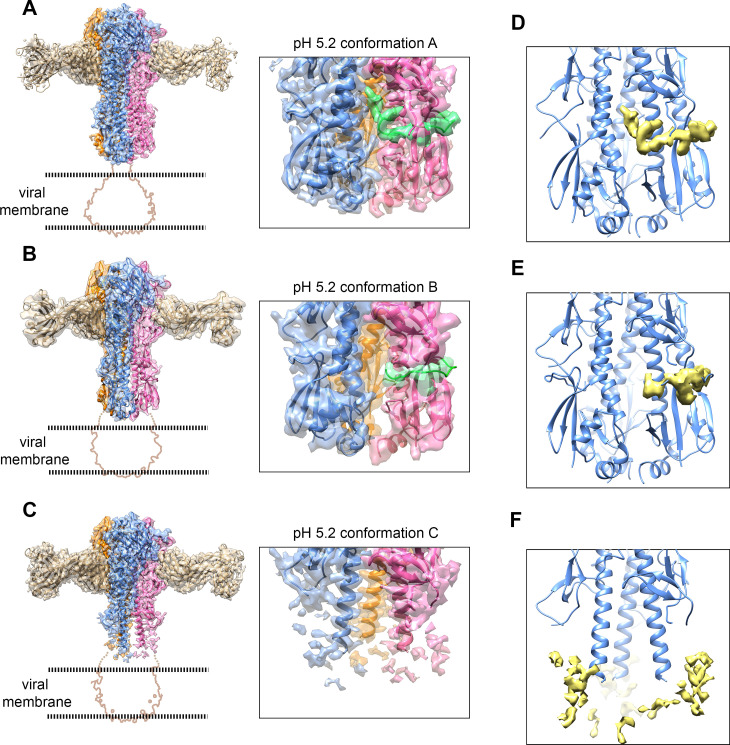
Fig 2. Structures of the HA-Fab complex at pH 5.2 showing the release of the fusion peptide.
(A to C) Surface-shadowed and ribbon diagrams showing the HA-Fab-pH 5.2 conformation A (A), conformation B (B) and conformation C (C). Semitransparent surfaces displayed with the backbone ribbons in the density maps. The density maps are contoured at 7 σ (A), 11 σ (B) and 7 σ (C), respectively. The profiles of the disordered transmembrane domain and the bound detergent micelle (map contoured at 3 σ) are indicated by brown lines. The fusion peptides are colored green. The zoomed-in views show the densities around the fusion peptides. (D to F) Surface-shadowed and ribbon diagrams showing the residue densities of the “zero out” maps for the three low pH conformations. The “zero out” maps were calculated by setting the values of the map grid points within a radius of 2.5 Å of each fitted model atom to zero [52]. The fusion peptide (residues 1–20 of the HA2) was excluded for all the calculations. The “zero out” residue density maps are colored yellow and contoured at 7 σ (D), 11 σ (E) and 7 σ (F), respectively.

