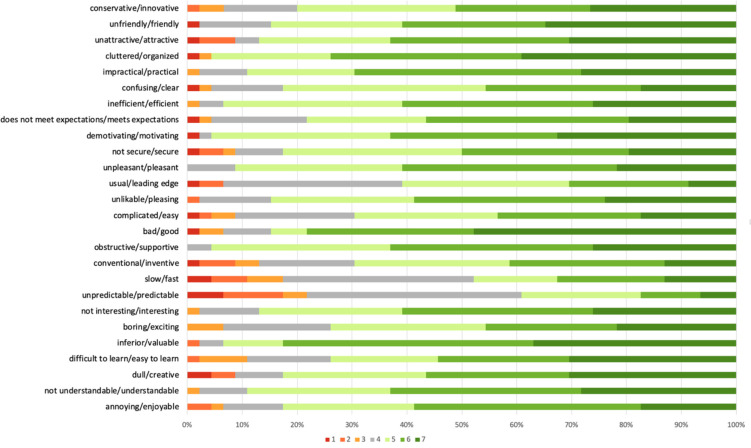
Fig 4. Distribution of participants’ answers across the 7-point scale are presented for each of the 26 items in the user experience questionnaire.
Colour coding varies based on the positive or negative attributes chosen to reflect user perspectives of the e-Learning platform. Colour-coding varied across the 7-point scale from 1 (dark red) suggesting a negative rating against the item (e.g. very conservative or very unfriendly) to 7 (dark green) suggesting a positive rating against the item (e.g. very innovative, very friendly).

