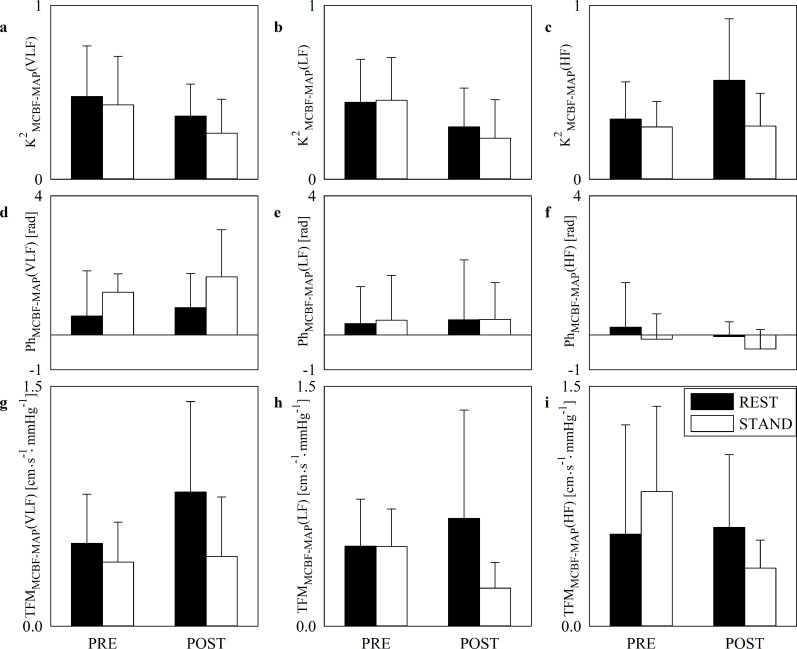
Fig 4. Cross-spectral analysis of MCBF and MAP series.
The error bar graphs show K2MCBF-MAP(VLF) (a), K2MCBF-MAP(LF) (b), K2MCBF-MAP(HF) (c), PhMCBF-MAP(VLF) (d), PhMCBF-MAP(LF) (e), PhMCBF-MAP(HF) (f), TFMMCBF-MAP(VLF), (g) TFMMCBF-MAP(LF) (h) and TFMMCBF-MAP(HF) (i) in PRE and POST. The solid black and white bars are relevant to bivariate frequency domain markers computed at REST and during STAND respectively. The horizontal solid line in (d), (e) and (f) marks the null phase. Data are given as mean plus standard deviation.

