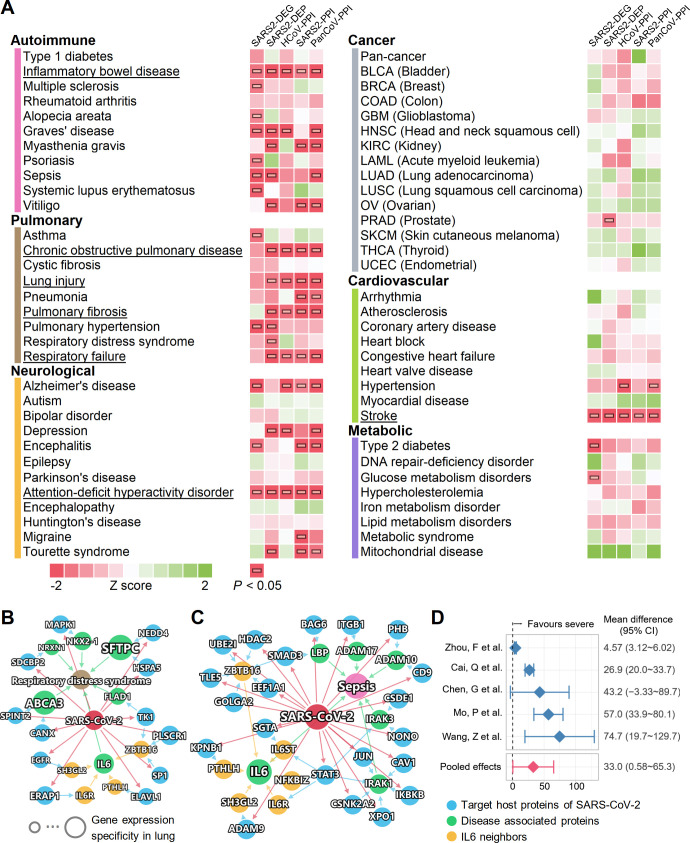
Fig 4. A landscape of disease manifestations associated with COVID-19 quantified by network proximity measure.
(A) Heatmaps showing the network proximities of COVID-19 with 64 diseases across 6 categories. The network proximities of the disease modules and the 5 SARS-CoV-2 datasets were evaluated using the “closest” network proximity measure (see Materials and Methods—Network proximity measure). The magnitude of the proximity is indicative of their biological relationship: Closer network proximity of SARS-CoV-2 host genes/proteins and a disease indicates higher potential of manifestation between COVID-19 and the disease. P < 0.05 computed by permutation test was considered significant (indicated by horizontal rectangles). Three categories, autoimmune, pulmonary, and neurological, frequently show significant proximities to COVID-19. Inflammatory bowel disease, attention-deficit/hyperactivity disorder, and stroke achieved significance with all 5 SARS-CoV-2 datasets. Underlined diseases are those highlighted in the Results. (B and C) Highlighted subnetworks between SARS-CoV-2 host genes/proteins and the disease-associated proteins of respiratory distress syndrome (B) and sepsis (C). (D) Clinical data analyses showed an association of COVID-19 severity with IL-6 expression levels in patients. Meta-analysis of the random effects model was performed using the mean difference in IL-6 (pg/ml). There was high heterogeneity among these studies (I2 = 94%, P < 0.001). The data underlying this figure can be found in S3 Data.

