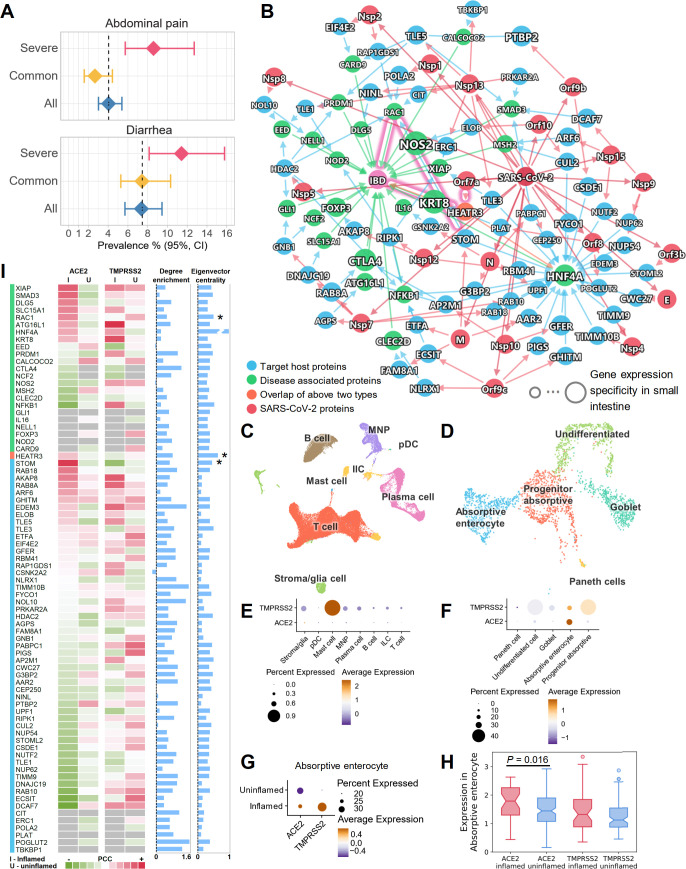
Fig 6. Inflammatory molecular profile between inflammatory bowel disease (IBD) and COVID-19.
(A) Patients with severe COVID-19 have higher risks of abdominal pain and diarrhea by meta-analysis. (B) A highlighted subnetwork between the IBD-associated genes, the SARS-CoV-2 virus proteins, and virus target proteins under the human interactome network model. (C) UMAP visualization of non-epithelial cells from the ileal tissues of patients with Crohn disease. (D) UMAP visualization of epithelial cells from the ileal tissues of patients with Crohn disease. (E) Cell-type-specific expression of ACE2 and TMPRSS2 in non-epithelial cells (C). (F) Cell-type-specific expression of ACE2 and TMPRSS2 in epithelial cells (D). (G) The co-expression of ACE2 and TMPRSS2 is elevated in absorptive enterocytes of inflamed ileal tissues compared to uninflamed tissues in patients with Crohn disease. (H) Box plot showing the expression of ACE2 and TMPRSS2 in absorptive enterocytes expressing ACE2 and TMPRSS2, respectively. (I) Co-expression analysis for the genes in the subnetwork with ACE2 and TMPRSS2. Heatmap shows the Pearson correlation coefficients (PCCs) of ACE2 and TMPRSS2 with other genes (labeled in [B]) in the absorptive enterocytes. Blue bars show the degree enrichment of the genes in the subnetwork compared to a random network of the same size (left) and the eigenvector centrality (right). Asterisks indicate that these genes may play important roles in COVID-19-associated IBD. The data underlying this figure can be found in S5 Data. Single-cell data were retrieved from the NCBI GEO database using the accession number GSE134809. See S1 Table for more details of the datasets.

