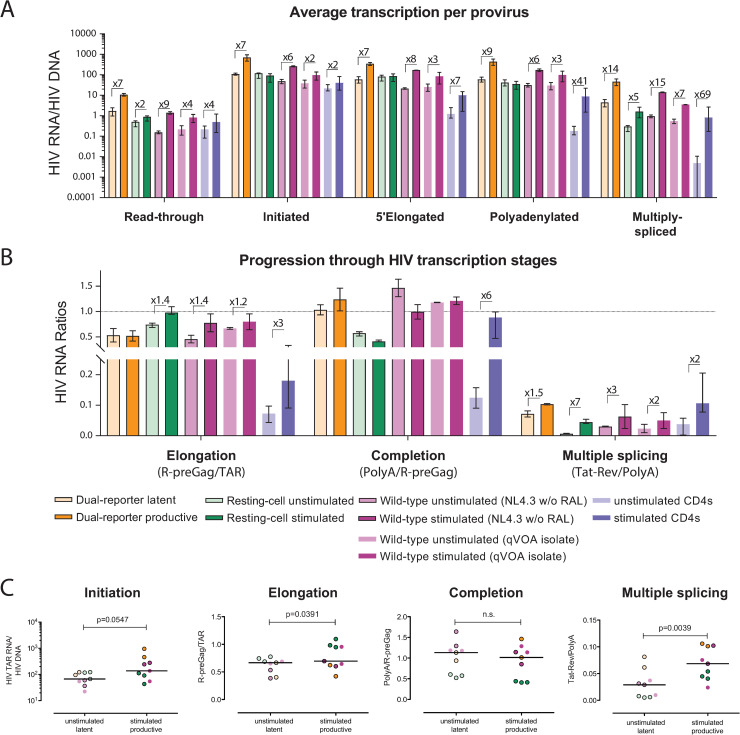
Fig 5. Primary cell HIV latency models recapitulate the block to multiple splicing observed in CD4+ T cells from ART-suppressed individuals.
Comparison of (A) Level of HIV transcripts per provirus, and (B) progression through HIV transcription stages in cells from the Dual-reporter (orange), the Resting-cell (green) and the Wild-type (purple) primary cell models, and cells from ART-suppressed individuals (blue), in latently- (light color) and productively-infected or stimulated cells (dark color). Median and range (bars) are shown. (C) Comparison of HIV transcriptional initiation, elongation, completion, and multiple splicing in the latent (unstimulated) and productive (stimulated) populations in all donors from the three main models shown in Figs 2–4. Bars indicate the median; P-values were calculated using the Wilcoxon signed rank test.

