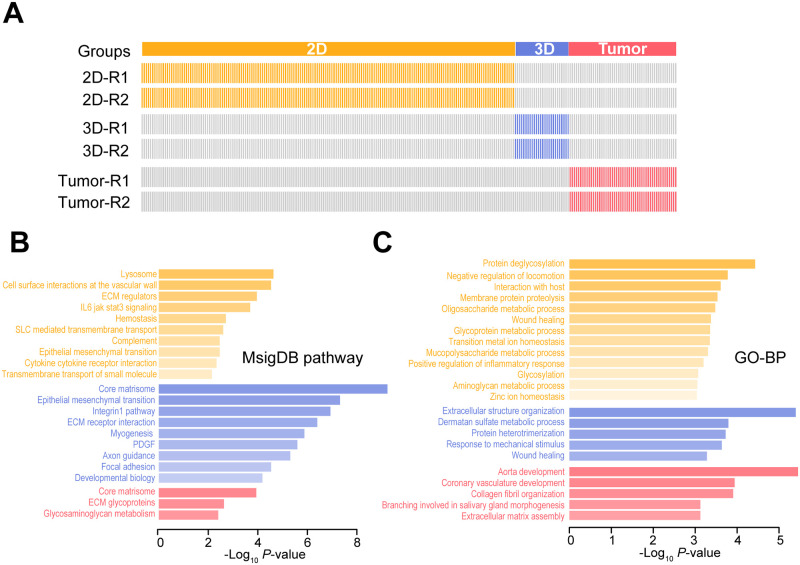
Fig 4. Global analysis of differentially expressed N-glycoproteins identified from 2D and 3D breast cancer cell cultures and xenografted tumors.
A. Heat map of unique N-glycoproteins expressed in two biological replications. Gray lines indicate the absence of the N-glycoprotein. Colored lines indicate the presence of the unique N-glycoprotein. B. Pathway analysis. C. Gene ontology biological process (GO-BP) enrichment analysis.

