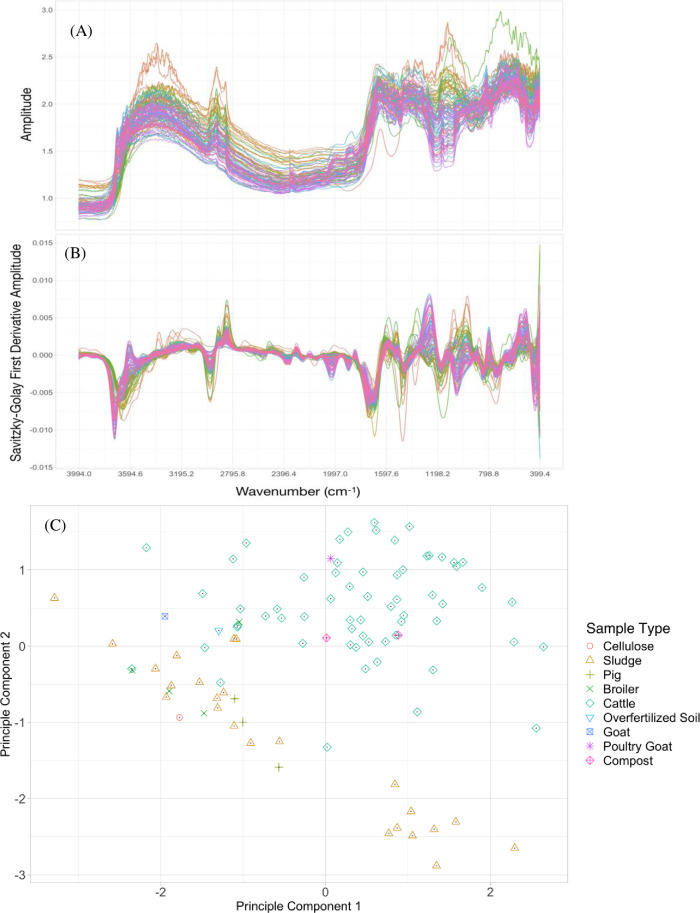
Fig 2. Illustrations of the diffuse reflectance mid infrared (DRIFT-MIR) spectra from the organic amendment (OA) samples.
(A) raw spectra, (B) pre-processed spectra and (C) Principal Component Analysis (PCA) scores plot (PC1 vs. PC2) for mid infrared (MIR) spectra from the OA samples (n = 98) based on sample types. The PCA was performed on the pre-processed MIR spectra.

