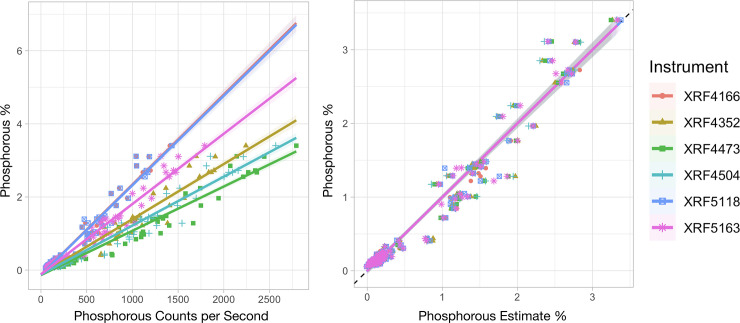
Fig 3. Inter-instrumental variability of pXRF instruments.
Fig 3A shows the relation between phosphorus-specific counts per second for six different instruments. XRF4166 line is hidden behind the blue XRF 5118 line in the left figure. Fig 3B shows the estimated phosphorus content of the samples after instrument specific calibration. The dotted line on the right plot indicates the expected 1:1 ratio for XRF estimates and known values and the shaded areas around all lines are 95% confidence predictions based on the calibration.

