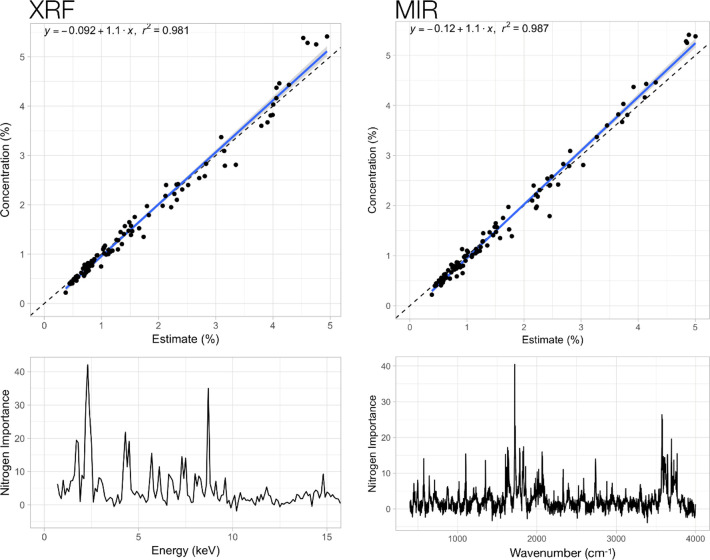
Fig 5. Comparison of actual and predicted total nitrogen (N) content of organic amendment (OA) samples based on whole-spectrum forest regressions for pXRF (instrument 900F4437) and DRIFT-MIR.
The dotted line indicates the expected 1:1 ratio for estimates and known values. The bottom graphs show the respective response variables in the spectra.

