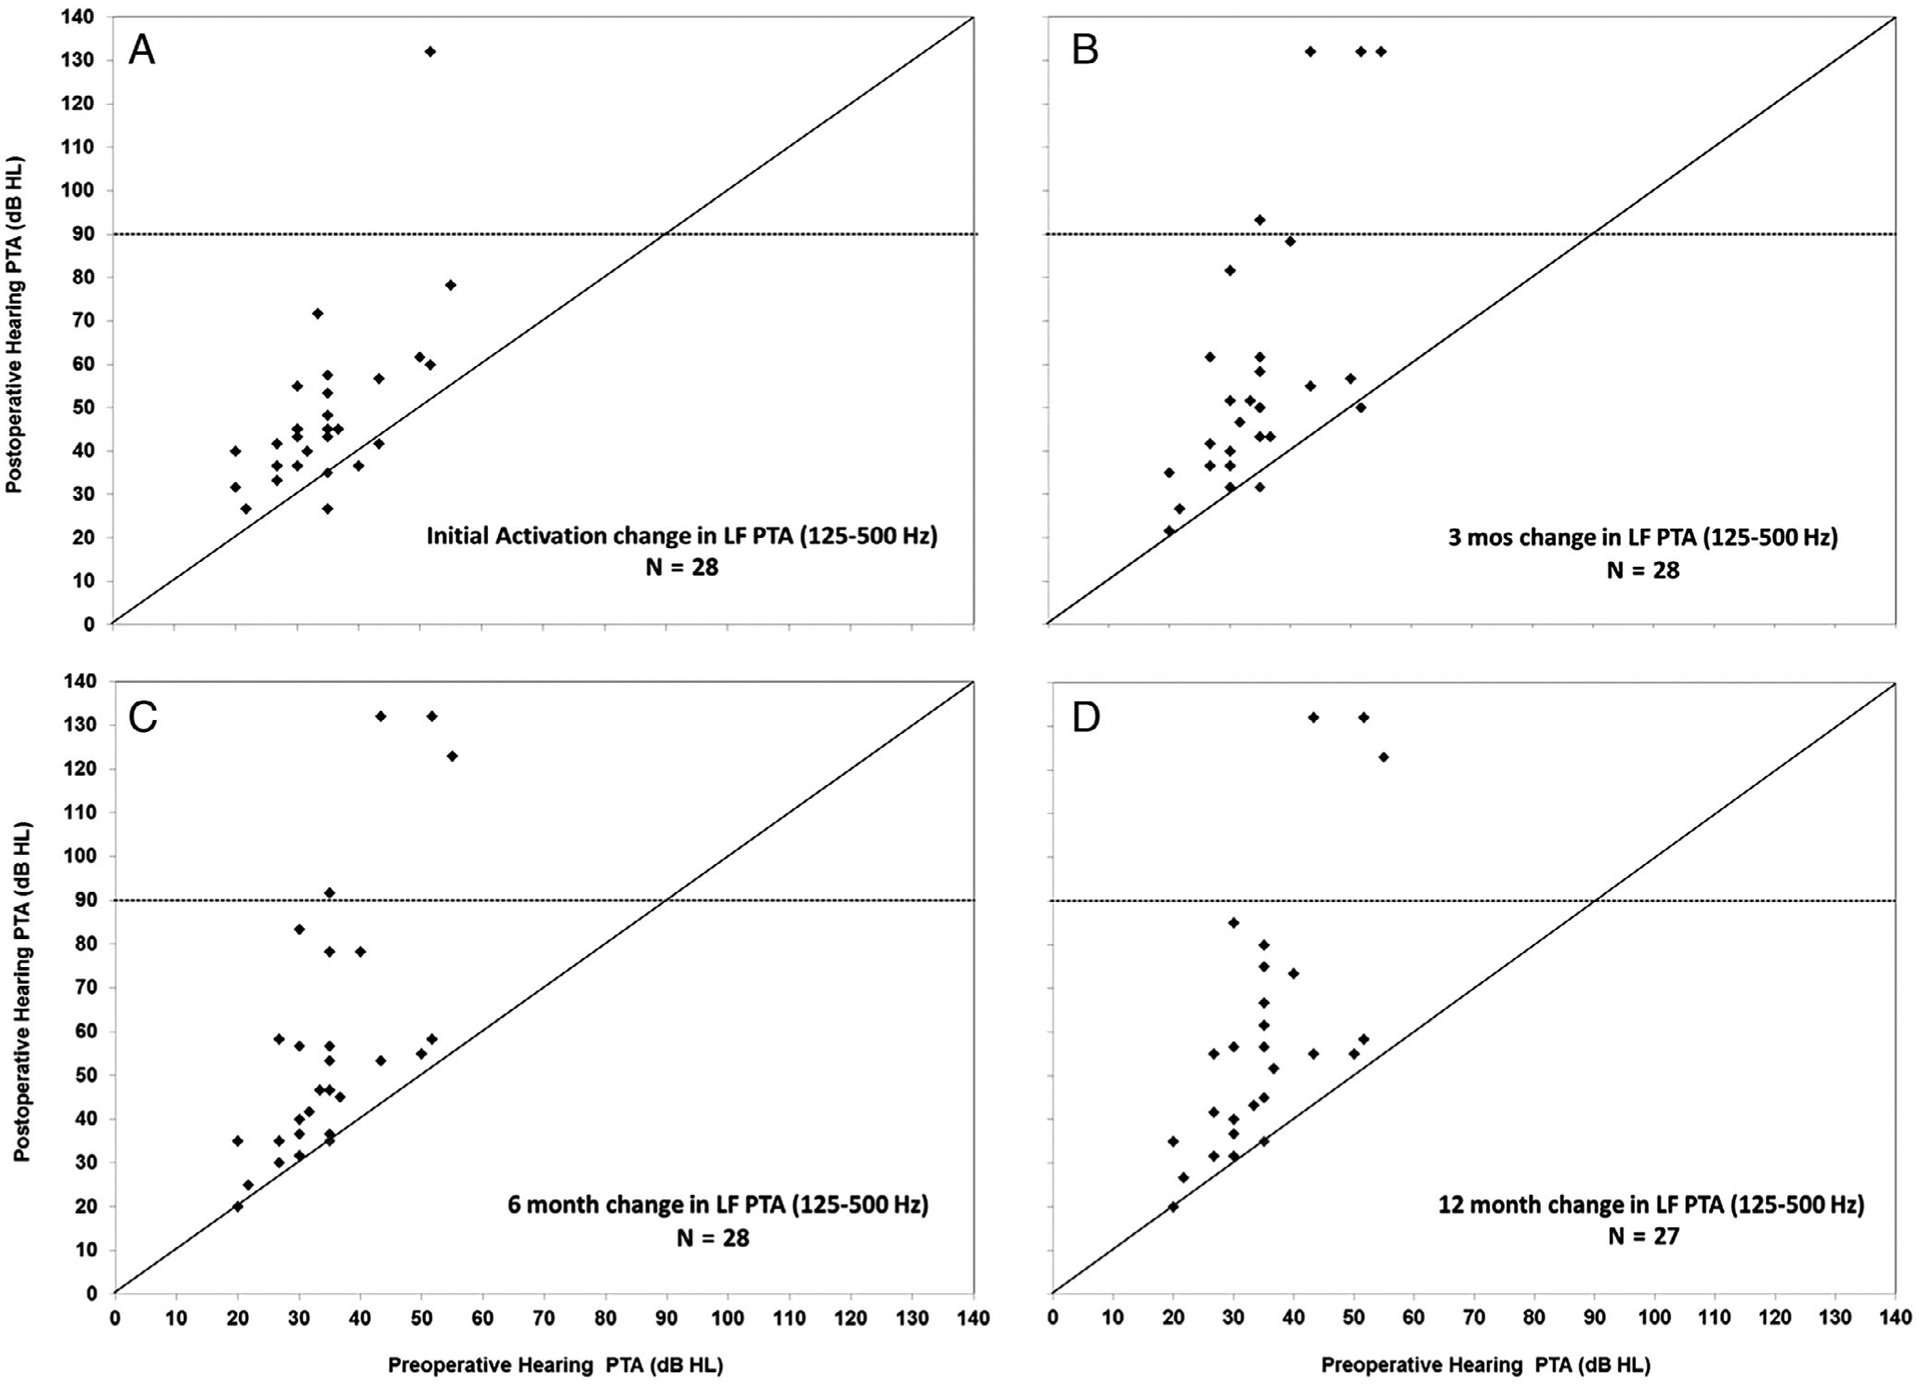
Fig. 2.

Change in individual subject low-frequency (LF) pure-tone average (PTA) at initial activation and longitudinally through 12 months postimplantation. Horizontal axis in each panel shows the preoperative LF PTA versus postoperative LF PTA at initial activation (A), 3 months (B), 6 months (C), and 12 months (D) on the vertical axis.
