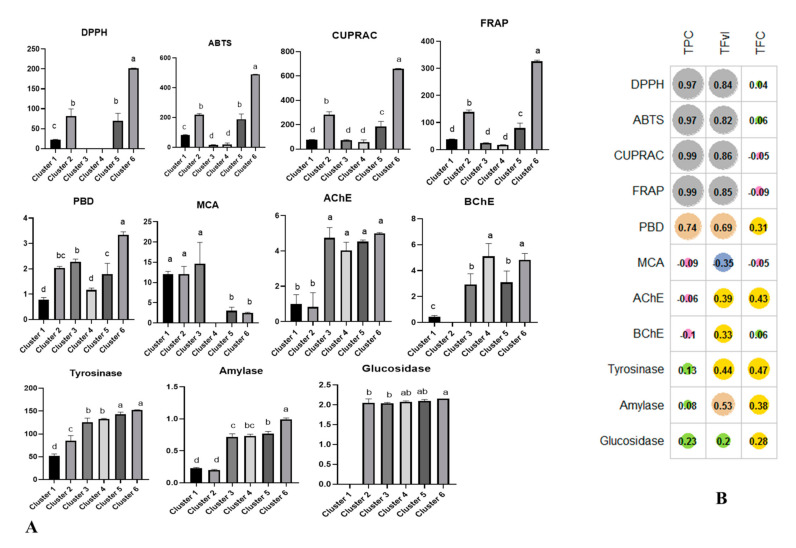
Figure 10.
Investigation of biological activities characterizing the different clusters and their relationship with phenolic contents. (A), Comparison in obtained clusters; (B), Pearson correlation between total bioactive compounds and biological activity assays. Different letters (a–d) indicate significant differences in the clusters.

