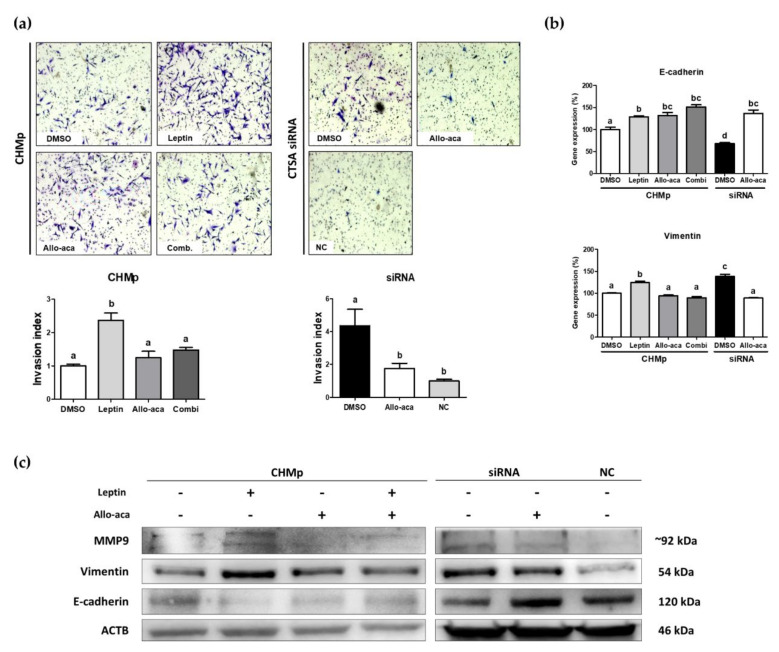
Figure 3.
Leptin stimulated epithelial–mesenchymal transition (EMT) in CHMp cells. (a) Matrigel invasion assay and calculated invasion index of CHMp and siRNA-transfected cells. Invaded cells were counted under light microscopy (40×) using ImageJ software. (b) Comparison of EMT-related gene (E-cadherin and vimentin) expression using real-time PCR analysis among experimental groups. (c) Western blot analysis of tumor invasion-related genes. All graphs are visualized as mean ± SEM with at least three replicates. The column bars with different alphabetical letters indicate significant difference among groups (p < 0.05). Combi: combination of leptin and Allo-aca; NC: negative control siRNA.

