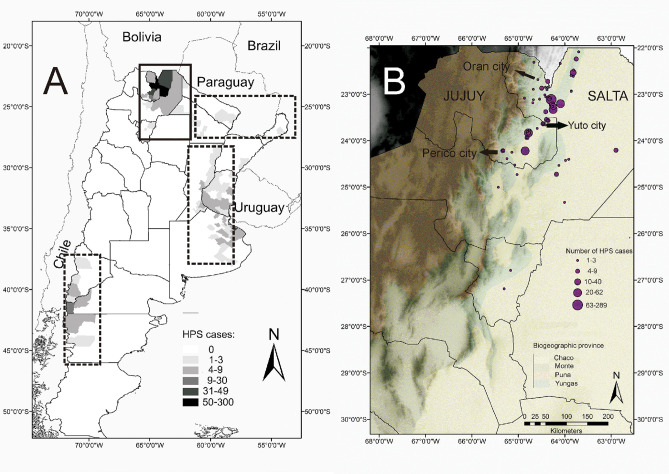
Fig 1. Distribution of hantavirus pulmonary syndrome (HPS).
(A) The cumulative number of HPS cases in the 4 endemic regions of Argentina indicated by rectangles and grayscale for every second-level administrative division. (B) Hantavirus pulmonary syndrome cases in Northwestern Argentina; the circles indicate the location of HPS cases and the size of each circle is proportional to the number of cases. Localities are listed in Table S1 Table. The 4 biogeographic regions are represented by the colors indicated in the reference key. Map built with QGIS 3.1 Geographic Information System. Open Source Geospatial Foundation Project (http://qgis.osgeo.org).

