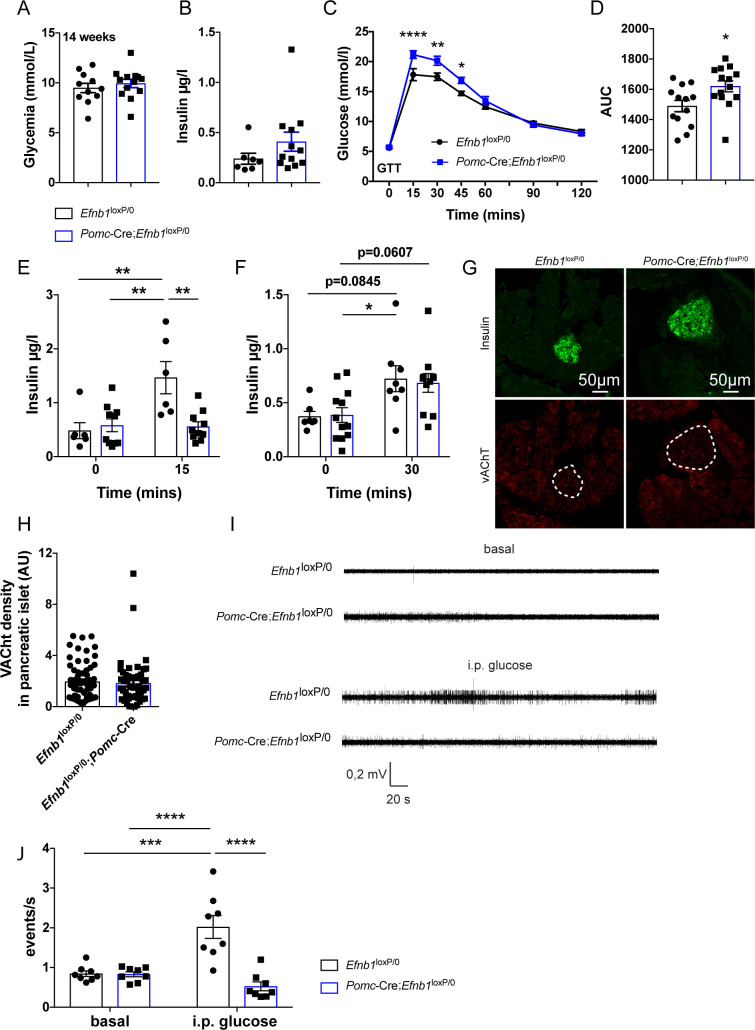
Fig 6. Loss of Efnb1 in POMC-expressing progenitors causes glucose intolerance in males.
(A) Basal glycemia of 14-week-old male mice (n = 11–13/group). (B) Basal insulinemia of 16–18-week-old male mice (n = 7–12/group). (C) Glucose tolerance test of 8–9-week-old male mice (n = 13–14/group). (D) Area under the curve of the glucose tolerance test. Glucose-induced insulin secretion test of 9–10-week-old male mice (n = 6-12/group) 15 minutes (E) and 30 minutes (F) after glucose injection. (G) Confocal images illustrating cholinergic vAChT-positive fibers (red) in pancreatic islets labeled with insulin (green) of 16–18-week-old male mice. (H) Quantification of cholinergic fiber density in pancreatic islets (n = 3 animals/group, between 16 and 27 islets per animal). Representative traces (I) and quantification (J) of parasympathetic nerve firing rate in the basal state and following IP glucose injection in mice (n = 8/group). Data are shown ± SEM. Statistical significance was determined using 2-way ANOVA (C, E, F, J) and 2-tailed Student t test (A, B, D, H). *P ≤ 0.05 versus Efnb1loxP/0 (C, D) and versus Pomc-Cre;Efnb1loxP/0 (F); **P ≤ 0.01 versus Efnb1loxP/0 (C, E) and versus Efnb1loxP/0;Pomc-Cre (E); ***P ≤ 0.001 versus Efnb1loxP/0 (J) and versus Efnb1loxP/0;Pomc-Cre (J); ****P ≤ 0.0001 versus Efnb1loxP/0 (C). The underlying data are provided in S1 Data. ANOVA, analysis of variance; GTT, glucose tolerance test; IP, intraperitoneal; POMC, proopiomelanocortin; SEM, standard error of the mean.

