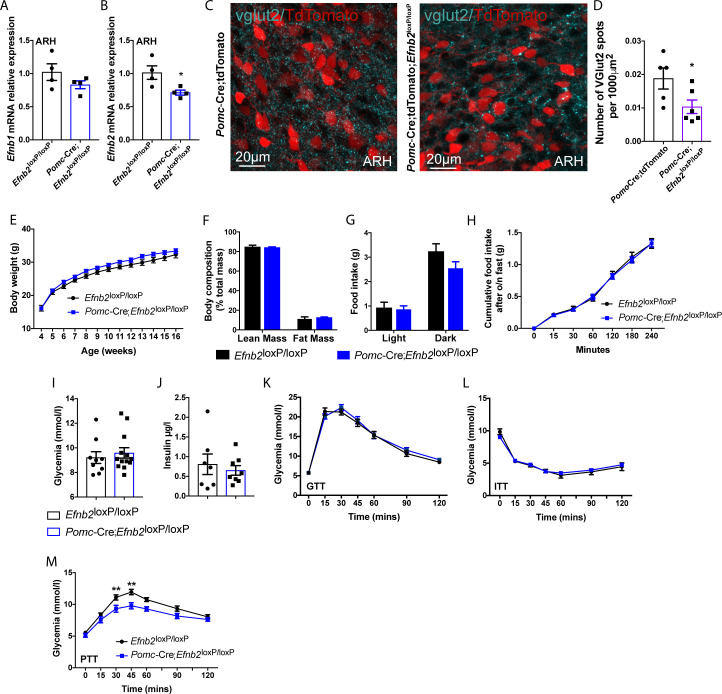
Fig 7. Loss of Efnb2 in POMC-expressing progenitors causes impaired gluconeogenesis in males.
Efnb1 (A) and Efnb2 (B) mRNA relative expressions in ARH of adult Efnb2loxP/loxP and Pomc-Cre;Efnb2loxP/loxP male mice (n = 4/group). (C) High magnification of vGLUT2-positive terminals into POMC-expressing progenitors (red) in Pomc-Cre;tdTomato control and Pomc-Cre;Efnb2loxP/loxP;tdTomato mutant male mice. (D) Quantification of vGLUT2-positive inputs in direct apposition with Pomc-Cre;tdTomato neurons (red) in female mice (n = 3/group, 2 sections/animal). (E) Post-weaning growth curve of Efnb2loxP/loxP and Pomc-Cre;Efnb2loxP/loxP male mice (n = 11–14/group). (F) Body composition of 16-week-old male mice (n = 7–12/group). (G) Food intake of 13–14-week-old male mice (n = 6–10/group). (H) Refeeding after overnight fasting of 13–14-week-old male mice (n = 13–15/group). (I) Basal glycemia of 8-week-old male mice (n = 9-13/group). (J) Basal insulinemia of 16-week-old male mice (n = 7-8/group). (K) Glucose tolerance test of 8–9-week-old male mice (n = 11–13/group). (L) Insulin tolerance test of 14-week-old male mice (n = 7–12/group). (M) Pyruvate tolerance test of 12–13-week-old male mice (n = 11–13/group). Data are shown ± SEM. Statistical significance was determined using 2-way ANOVA (D–G; J–L) and 2-tailed Student t test (A, B, D; I, J). *P ≤ 0.05 versus Efnb2loxP/loxP (B) and versus Pomc-Cre;tdTomato (D); **P ≤ 0.01 versus Efnb2loxP/loxP (M). The underlying data are provided in S1 Data. ANOVA, analysis of variance; ARH, arcuate nucleus of the hypothalamus; ITT, insulin tolerance test; POMC, proopiomelanocortin; PTT, pyruvate tolerance test; SEM, standard error of the mean.

