. 2020 Dec 3;9:e62618. doi: 10.7554/eLife.62618

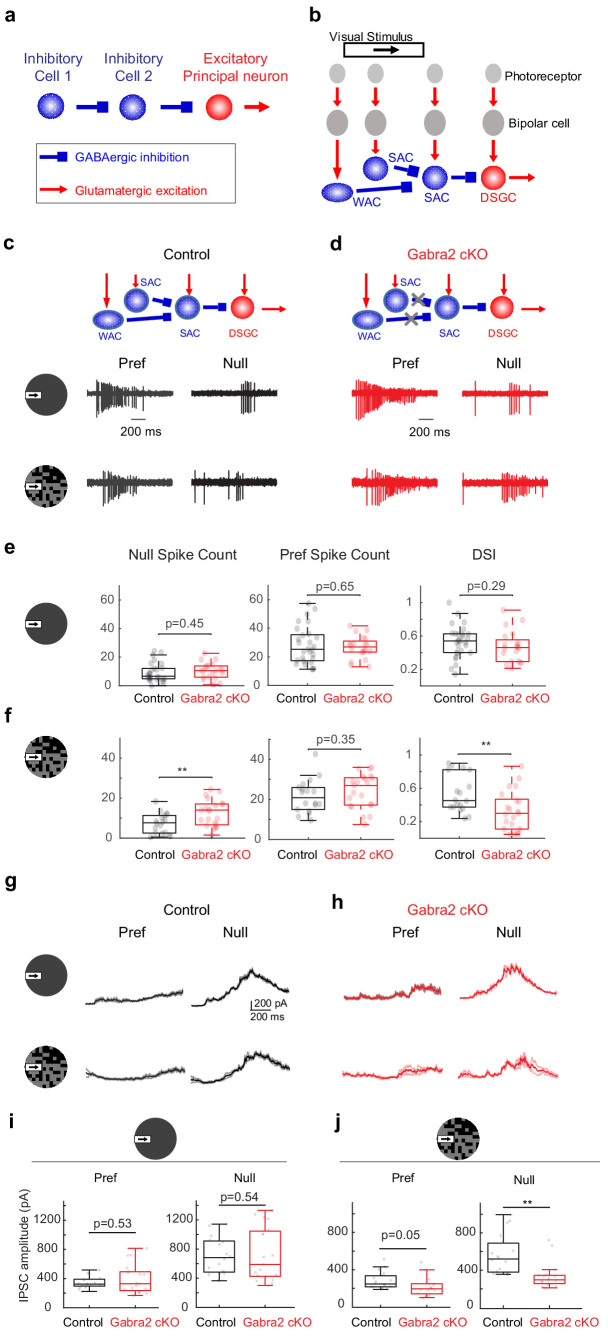
Figure 1. On-Off DSGCs in Gabra2 cKO mice show reduced direction selectivity and reduced null-direction inhibition in the noisy background.

(a) Organization of a canonical disinhibitory microcircuit. (b) Schematic of disinhibitory motifs WAC-SAC-DSGC and SAC-SAC-DSGC in the direction-selective circuit. WAC, SAC, and DSGC receive light-evoked glutamatergic inputs from the photoreceptor-bipolar cell signaling pathway. DSGC axons leave the retina and innervate higher brain nuclei. (c-f) DSGC spiking activity (c) Upper: schematic of disinhibitory motifs in control mice. Lower: example spiking activity of a DSGC in the control group during a moving bar in the preferred (pref) and null directions in noise-free (upper traces) and noisy (lower traces) backgrounds. (d) Same as c, from a DSGC in the Gabra2 cKO group. (e) Summary plots of null-direction (left), preferred-direction (middle) spike counts and direction selectivity index (DSI, see Materials and methods) in control and Gabra2 cKO groups for moving bar in the noise-free background. Box plots represent minimum / first quartile / median / third quartile / maximum values for this and subsequent figures, dots represent individual cells. Control: n = 19 cells from 6 mice. Gabra2 cKO: n = 20 cells from 6 mice. (f) Same as (e) for moving bar in the noisy background. (g-j) DSGC IPSC . (g) Example bar-evoked IPSC traces of a DSGC in the control group during a moving bar in the preferred and null directions in noise-free (upper traces) and noisy (lower traces) backgrounds. Three individual trials (thin lines) and the mean (thick line) are shown. (h) Same as g, from a DSGC in Gabra2 cKO group. (i) Summary plots of preferred- (left) and null-direction (right) IPSC peak amplitudes in control and Gabra2 cKO groups for moving bar in the noise-free background. Control: n = 17 cells from 6 mice. Gabra2 cKO: n = 20 cells from 7 mice. (j) Same as I, for moving bar in the noisy background. See also Figure 1—figure supplements 13.

Figure 1—source data 1. On-Off DSGCs inGabra2cKO mice show reduced direction selectivity and reduced null-direction inhibition in the noisy background.

Figure 1.

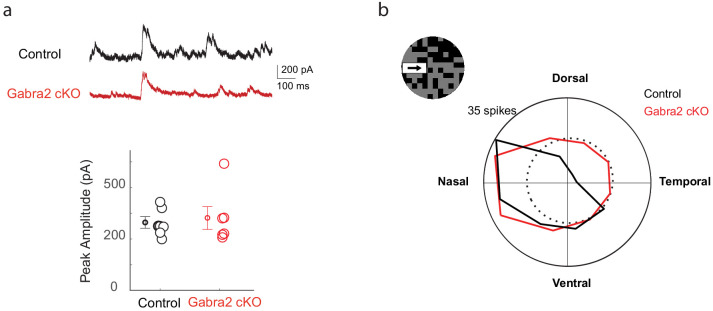
Figure 1—figure supplement 1. Flickering checkerboard-evoked DSGC response.

Figure 1—figure supplement 1.

(a) Upper: Example DSGC IPSC traces of control and Gabra2 cKO mice during the flickering checkerboard stimulus before the moving bar appeared. Lower: Average peak amplitude of flicker-evoked IPSCs. Data represent mean ±- SEM. Control: 6 cells, two mice. Gabra2 cKO: 6 cells, two mice. (b) Example polar plots of DSGC spiking response duirng the noisy bar stimulus.
Figure 1—figure supplement 1—source data 1. Flickering checkerboard-evoked DSGC response.

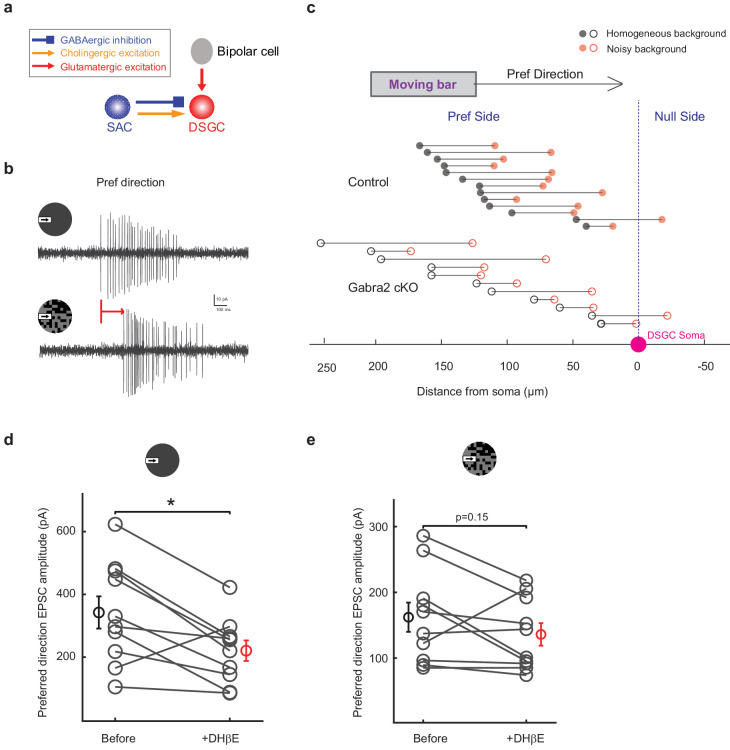
Figure 1—figure supplement 2. Excitatory inputs onto DSGCs in noisy background are primarily glutamatergic.

Figure 1—figure supplement 2.

(a) Schematic showing sources of synaptic inputs to DSGCs. Excitatory inputs to DSGCs include glutamatergic inputs from bipolar cells and cholinergic inputs from SACs. Cholinergic excitation of DSGCs from laterally connected SACs during the moving bar stimulus arrives earlier than glutamatergic excitation from vertically connected bipolar cells. (b) Example loose-attach recording of a control DSGC evoked by the leading edge of a moving bar in noise-free (upper) and noisy (lower) backgrounds. Red arrow indicates the delay of spiking onset in noisy background. (c) Spatial locations of the leading edge of the moving bar relative to the soma (pink dot at zero on the X-axis) at the onset of bar-evoked DSGC spiking response. For each DSGC, the bar locations for noise-free (black) and noisy (red) backgrounds are plotted at the same Y axis position and connected with a solid black line. Control group cells are represented by filled circles and Gabra2 cKO cells are represented by empty circles. The onset time of DSGC spiking activity was determined by a binless algorithm adapted from Chase and Young, 2007. Mean distance from soma: control noise-free background:127.6 ± 11.5 μm, control noisy background 73.0 ± 12.8 μm, n = 13 cells, Gabra2 cKO noise-free background: background 126.8 ± 21.5 μm, Gabra2 cKO noisy background 74.0 ± 17.7 μm, n = 11 cells. (d) Pair-wise comparison of preferred-direction EPSC amplitude evoked by the moving bar in noise-free background before and after application of 0.08 μM cholinergic receptor antagonist DhβE in control mice. n = 10 cells from five mice. (e) Same as d, during the moving bar stimulus in the noisy background.
Figure 1—figure supplement 2—source data 1. Excitatory inputs onto DSGCs in noisy background are primarily glutamatergic.

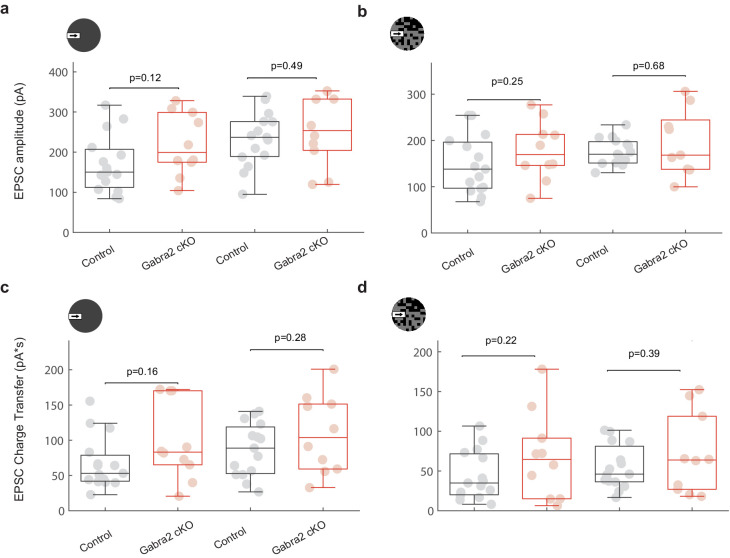
Figure 1—figure supplement 3. On-Off DSGC EPSCs are not affected in Gabra2 KO during the moving bar stimulus in the noisy background.

Figure 1—figure supplement 3.

(a) EPSC peak amplitudes in response to the moving bar in noise-free background in control (black) and Gabra2 cKO (red) mice. Left: null direction; Right: preferred direction. Control: 16 cells from six mice. Gabra2 cKO: 10 cells from eight mice. (b) Same as a, in the noisy background. (c) Same as a, for excitatory charge transfer (integral of EPSC over time). (d) Same as c, in the noisy background.
Figure 1—figure supplement 3—source data 1. On-Off DSGC EPSCs are not affected inGabra2KO during the moving bar stimulus in the noisy background.