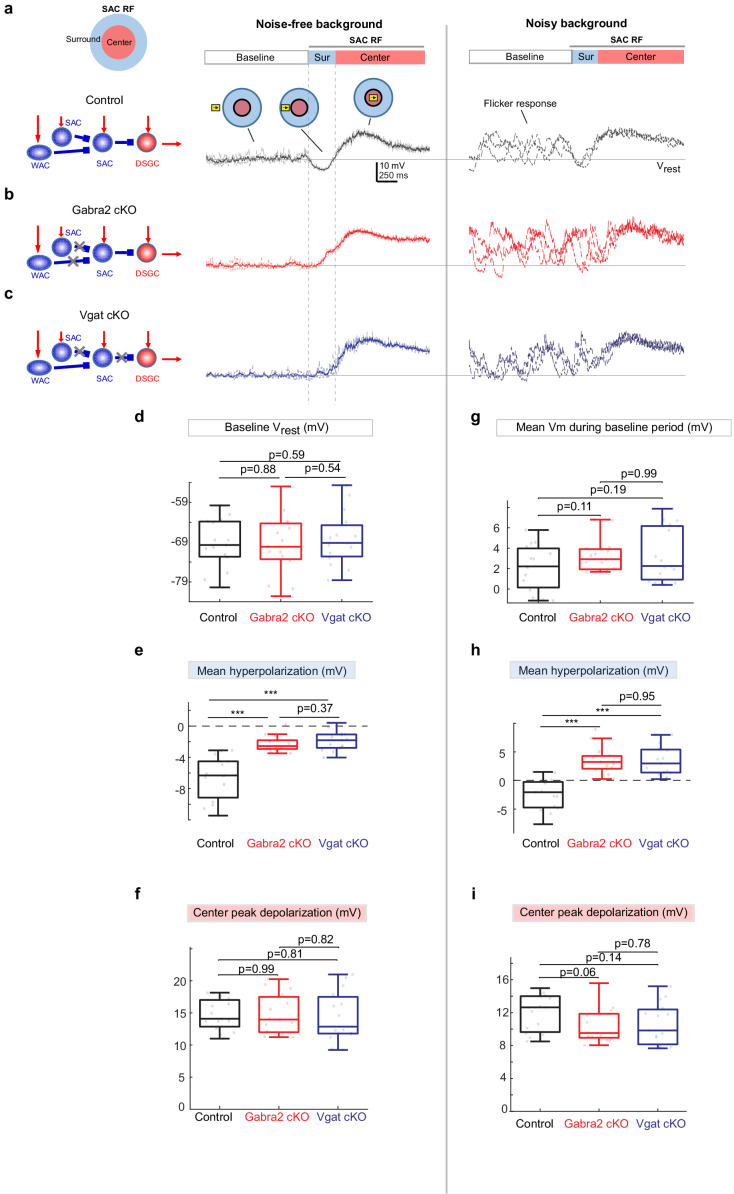
Figure 2. Weakened motion-evoked surround suppression of SACs in Gabra2 cKO and Vgat cKO mice.
(a) Example Vm traces from a control SAC during moving bar in noise-free (left) and noisy background (right). For noise-free condition, lighter traces are three individual sweeps and darker trace represents the mean. For noisy condition, three individual sweeps are shown. For each sweep, the flickering checkerboard pattern was randomly generated and differed from those of other sweeps. Horizontal line indicates the resting membrane potential Vrest calculated as the mean baseline Vm under the noise-free condition. Vertical dashed lines mark the surround suppression time window. Insets: Upper left: schematic of the center-surround RF structure of a SAC. Upper right: the time windows during which the bar moved outside the RF (‘Baseline’), in the RF surround (Sur) and center (‘Center’). (b) Same as a, from a SAC in the Gabra2 cKO group. (c) Same as a, from a SAC in the Vgat cKO group. (d-f): summary plots for noisy-free background.d.Mean Vm during the Baseline time window indicated in a. In noisy-free background it is equivalent to the resting membrane potential Vrest.e.Mean hyperpolarization calculated as the mean Vm during the Surround time window relative to Vrest.f.Peak depolarization calculated as the peak Vm during the Center time window relative to Vrest. (g-i): summary plots for noisy backgroundg.Mean Vm during the Baseline window relative to Vrest.h.Mean Vm during the Surround window relative to Vrest.i.Peak Vm during the Center time window relative to Vrest.Control, n = 15 cells from four mice. Gabra2 cKO, n = 15 cells from four mice. Vgat cKO, n = 15 cells from four mice. See also Figure 2—figure supplement 1.


