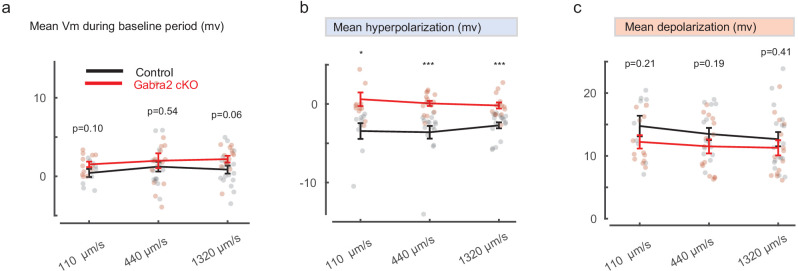
Figure 5. The activation pattern of Gabra2 cKO SACs during motion in the noisy background induces synaptic depression between SACs and DSGCs in control mice.
(a) Top traces: the scaled control (black) and Gabra2 cKO (red) waveforms during noisy bar stimulus used to voltage-clamp SAC somatic Vm in control mice. Middle traces: holding currents of a SAC during the paired SAC-DSGC voltage-clamp recordings. Downward deflections represent SAC calcium currents activated by membrane depolarization. Lower traces: DSGC IPSCs evoked by the control and the cKO waveforms. Schematic on top of the traces indicates time windows corresponding to the baseline period, bar-evoked surround suppression and bar-evoked depolarization during current clamp experiments in Figure 2. Green boxes numbered 1, 2, and 3 are regions in baseline, surround and center time windows chosen for subsequent quantification. (b) Pair-wise comparisons of DSGC IPSC amplitude evoked by the scaled (4x) control and cKO waveforms in time windows 1 and 3. For each cell pair, the IPSC peak amplitude evoked by the cKO waveform is normalized to that of the control waveform for each time window. N = 17 pairs from seven mice. (c) Same as a, with a different representative cKO waveform. (d) As b, but with different scale factors for the SAC command waveforms in c. (e) Example control SAC Vm traces during moving bar stimuli over gray background at various speeds. (f) Duration of the hyperpolarization window during noise-free moving bar as a function of bar speed. 110 μm/s: 11 cells, 4 mice, 440 μm/s: 15 cells, 4 mice, 1320 μm/s: 21 cells, 6 mice. Data are represented as mean ± SEM. (g) Same as a, but with scaled cKO SAC Vm waveforms at 110 μm/s (upper) and 1320 μm/s (lower). For control waveforms, mean membrane potential of the control waveforms replaces the cKO traces in the surround suppression time window. (h) Summary of synaptic suppression of the SAC-DSGC synapse induced by the Gabra2 cKO waveform relative to the response evoked by the control waveform for various motion speeds. Noise-induced expression is calculated as the percentage decrease of motion-evoked cKO response relative to the control. 110 µm/s: 11 pairs from three mice; 440 µm/s: 17 pairs from seven mice; 1320 µm/s: 11 pairs from three mice. Data are represented as mean ± SEM. See also Figure 5—figure supplement 1.


