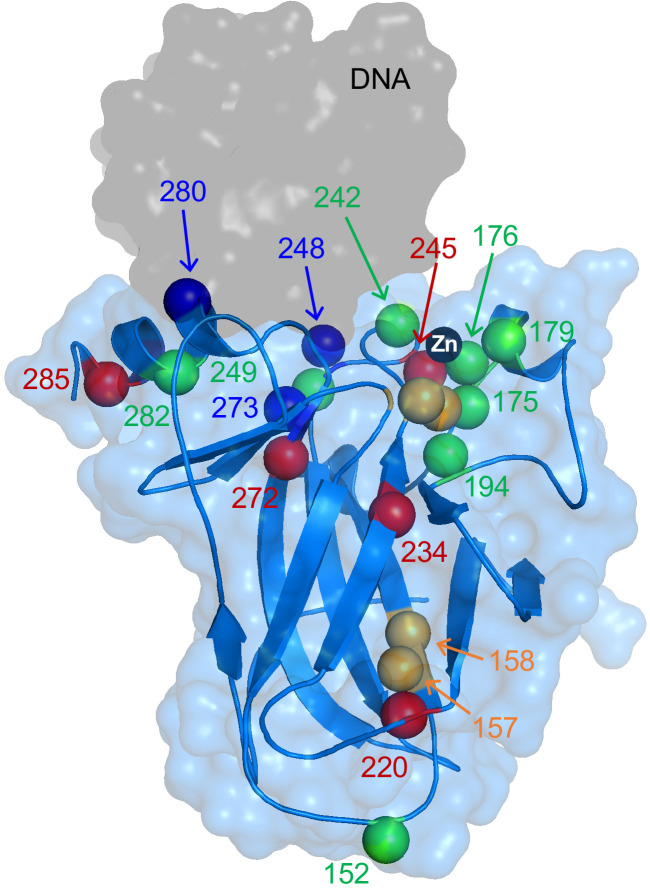
Figure 1. X-ray structure of WT DBD showing locations of mutations characterized in this study.
Alpha carbons of mutated residues are colored according to their classifications described in Results: zinc-binding class (green), stability class (red), DNA-binding class (blue), and mixed zinc-binding/stability class (orange). DNA and Zn2+ are the gray surface and black sphere, respectively. PDB 1TSR.

