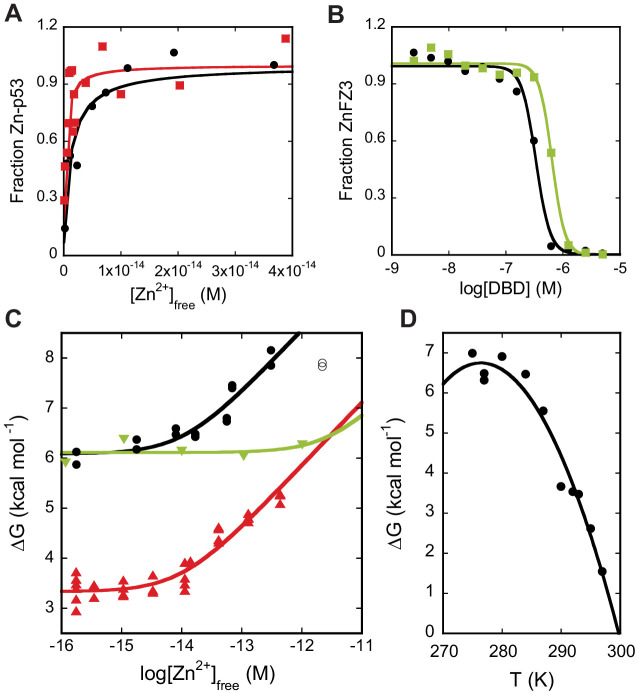
Figure 2. Zinc-binding affinity and stability of DBD.
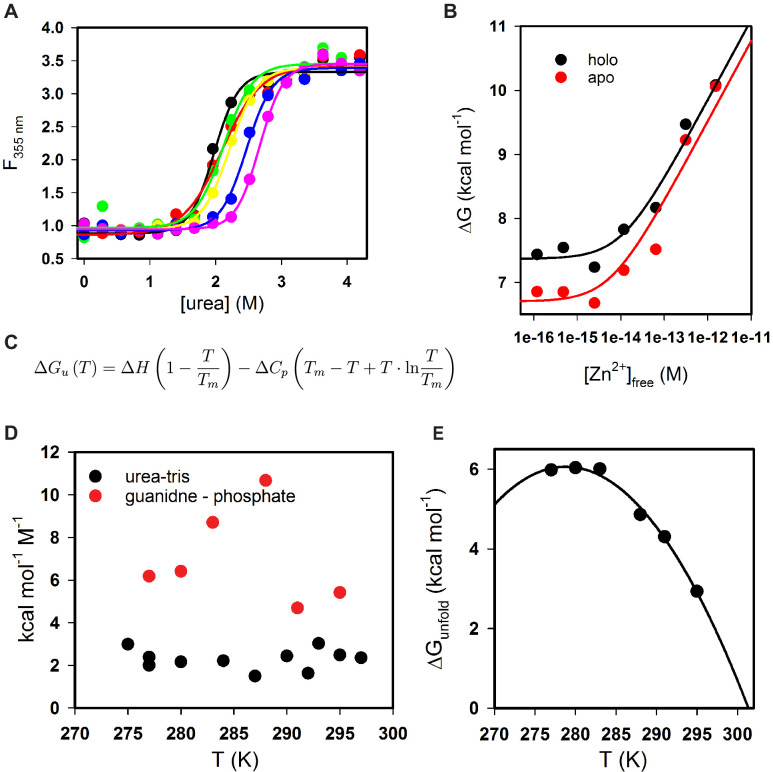
(A) WT DBD (black) and full-length WT p53 (red) bind Zn2+ with KZn values of (1.6 ± 0.3) x 10−15 M and (0.4 ± 0.1) x 10−15 M, respectively, as determined by change in Tyr fluorescence (10°C, n = 3, SD). (B) Unfolded WT DBD (black) and unfolded C176S DBD (green), bind Zn2+ with KZn,U values of (42 ± 7) x 10−9 M and (50 ± 23) x 10−9 M, respectively, as determined by FluoZin-3 competition in 6 M urea (10°C, n = 3, SD). (C) Plotting folding free energy of DBD vs. [Zn2+]free (10°C) reveals that R175H (green) is a pure zinc-binding-class mutant whereas A138V (red) is a pure stability-class mutant. The point at which the lines deflect upwards are the approximate KZn values. WT DBD is in black. Open points denote outliers excluded from analysis. Outliers were identified on inspection and rejected if their exclusion (1) improved goodness of fit, and (2) produced a model for which they lay outside the 95% prediction interval. (D) Temperature dependence of apoDBD folding free energy fit to the Gibbs-Helmholtz equation (Figure 2—figure supplement 1C) yields ΔHm = 171 ± 20 kcal mol−1, Tm = 300 ± 1 K, and ΔCp = 7.0 ± 1.7 kcal mol−1 K−1 (fit value ± SE of fit). In (C and D), independent experimental data were pooled and fit once, and results are reported as the fit parameters and standard effort of the fit. Otherwise (A, B), replicates consisted of independent experiments performed with the same preparations of purified proteins, which were fit separately and the results pooled. Single curves are shown in the figure for illustration.


