
Fig. 5.
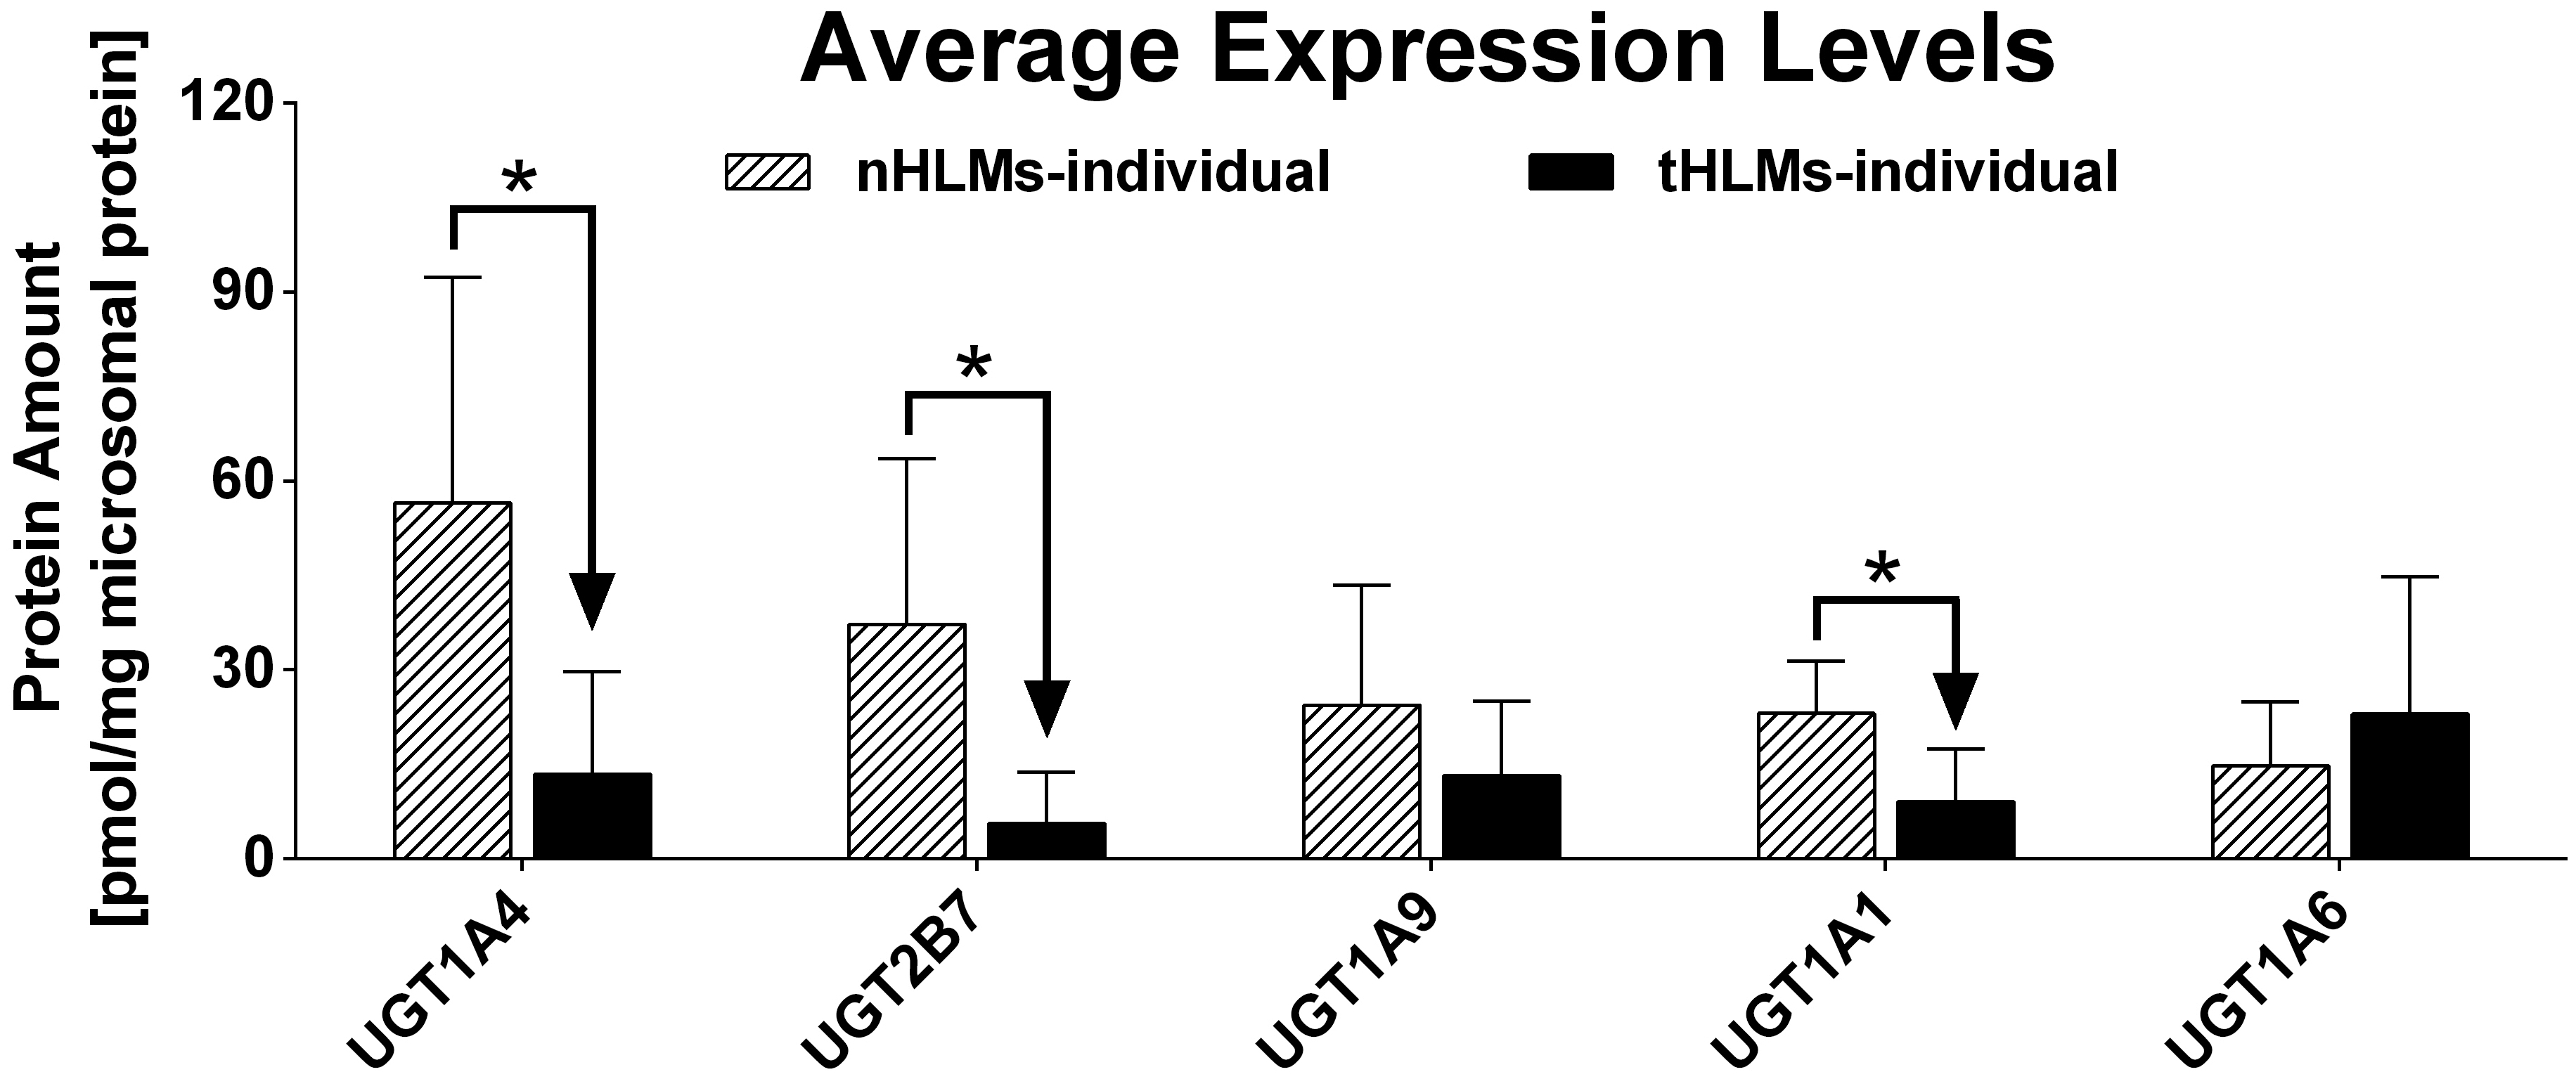
Average expression level of five UGTs in 15 tumor tissues and pericarcinomatous tissues. The error bar represents the standard deviation calculated from the protein amount of each isoform in 15 donors. Mann-Whitney U test was used for data analysis. “*” denotes statistical significance (p<0.05).