
Fig. 7.
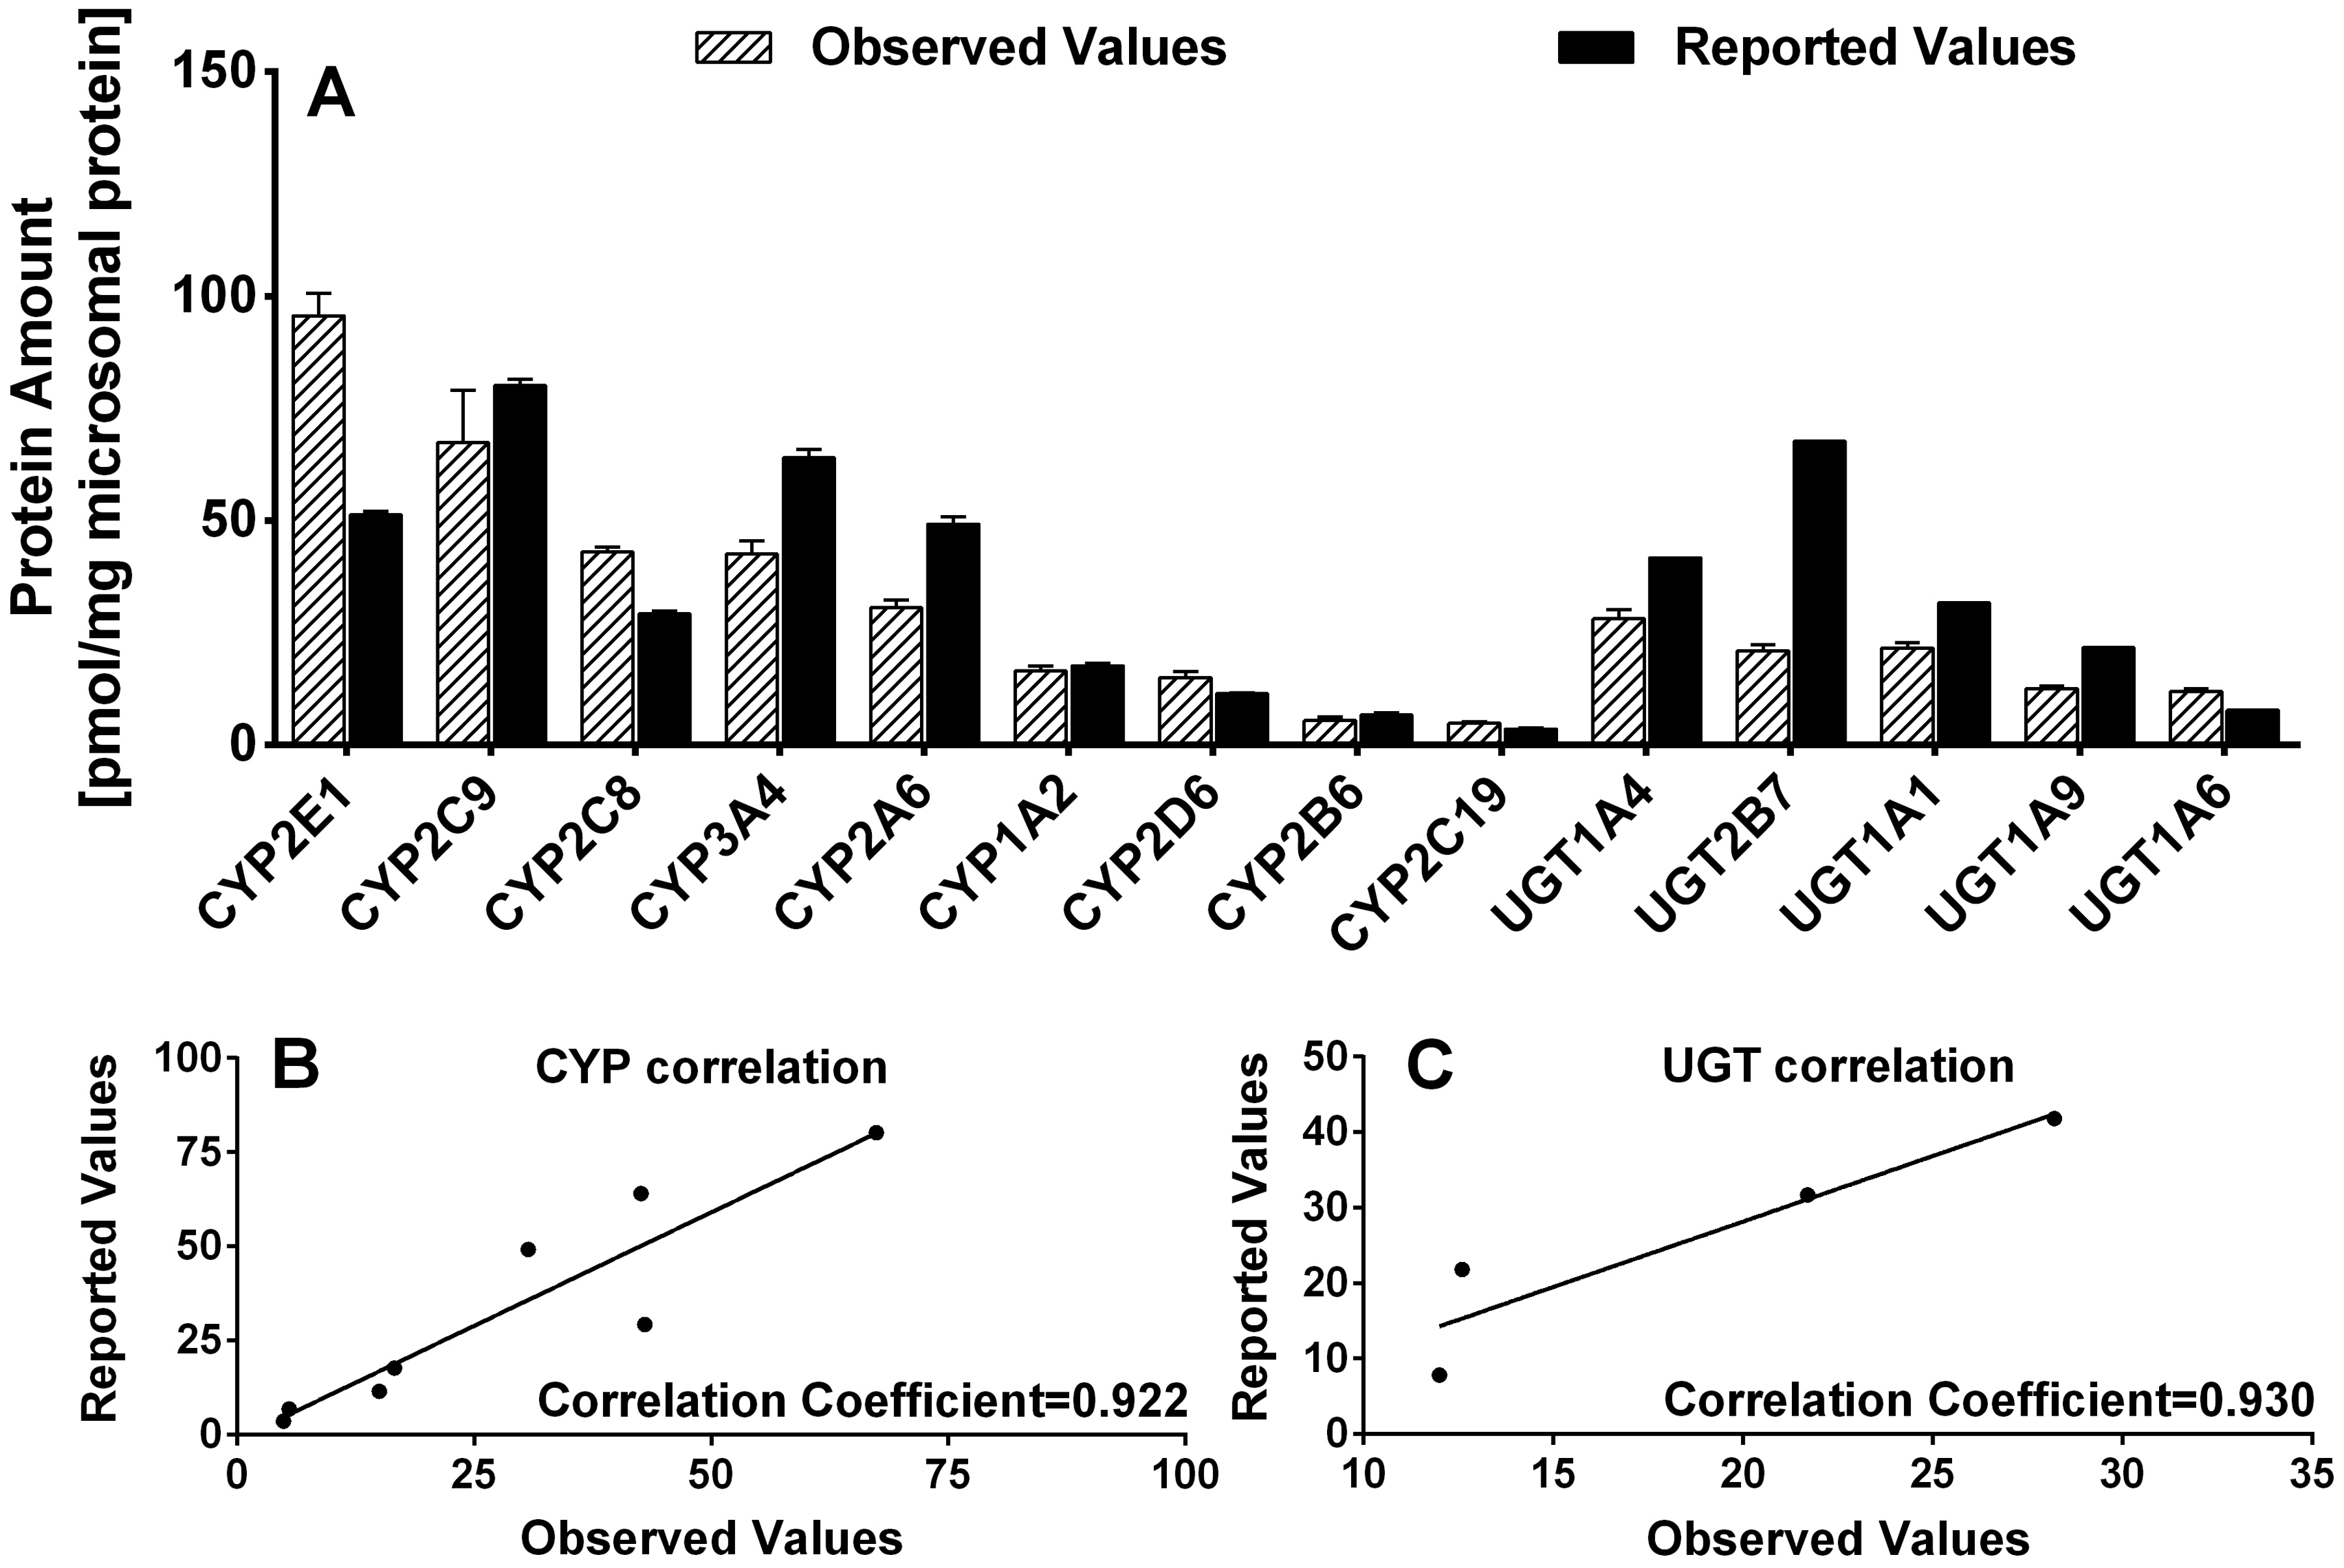
(A) A comparison of CYPs and UGTs expression levels in rHLMs-pooled observed in the present study (Observed Values) with values reported previously (Reported Values). (B) The correlation plots of the observed and reported values of nine CYP isoforms. (C) The correlation plots of the observed and reported values of four UGT isoforms.