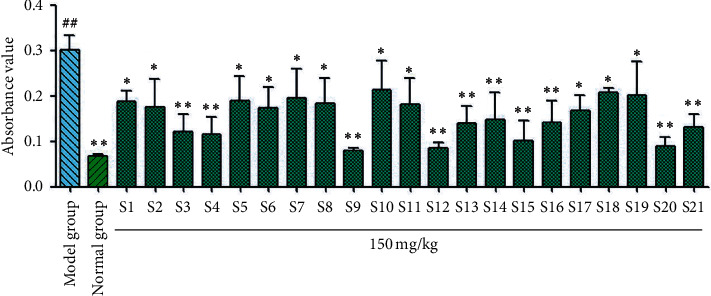
Figure 4.

Results of tracheal phenol red of flavonoids in Glycyrrhiza uralensis Fisch. from 21 producing areas. The result represents mean ± S.D. Note. Compared with the normal group, ##P < 0.01 is a very significant difference. Compared with the model group, ∗P < 0.05 was considered as significant difference; ∗∗P < 0.01, and there was a significant difference (n = 10).
