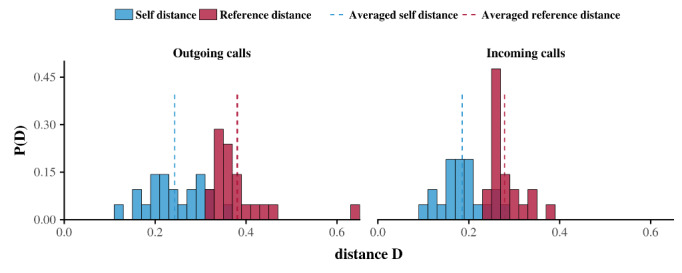
Figure 4.

Average persistence histogram. Red bars represent the average reference distances, whereas blue bars represent the average self-distances for all egos in this study. Blue and red dashed lines represent the average reference distance and the average self-distance of the overall population, respectively. The results show that, on average, the self-distance of egos is less than their reference distance, which is evidence of circadian rhythms in telephone activity among older adults.
