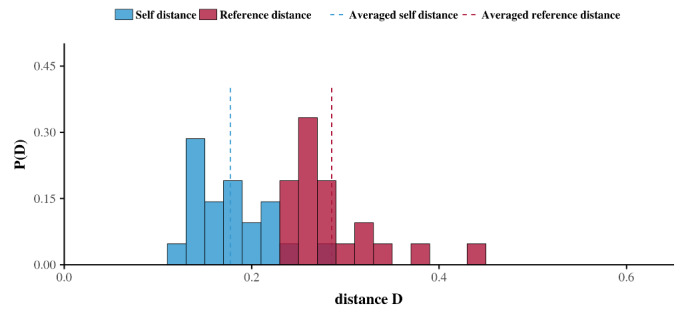
Figure 6.

Histogram showing the average persistence for mixed outgoing-incoming telephone calls. Red bars represent the averaged reference distances, whereas blue bars represent the averaged self-distances for all the egos in the study. Blue and red dashed lines represent the averaged self-distance and the averaged reference distance of the overall population in the study, respectively. The results suggest that, on average, individuals have a self-distance that is less than their reference distance, which implies that, when mixing outgoing and incoming telephone calls without distinction, the daily rhythms of older adults persist over time.
