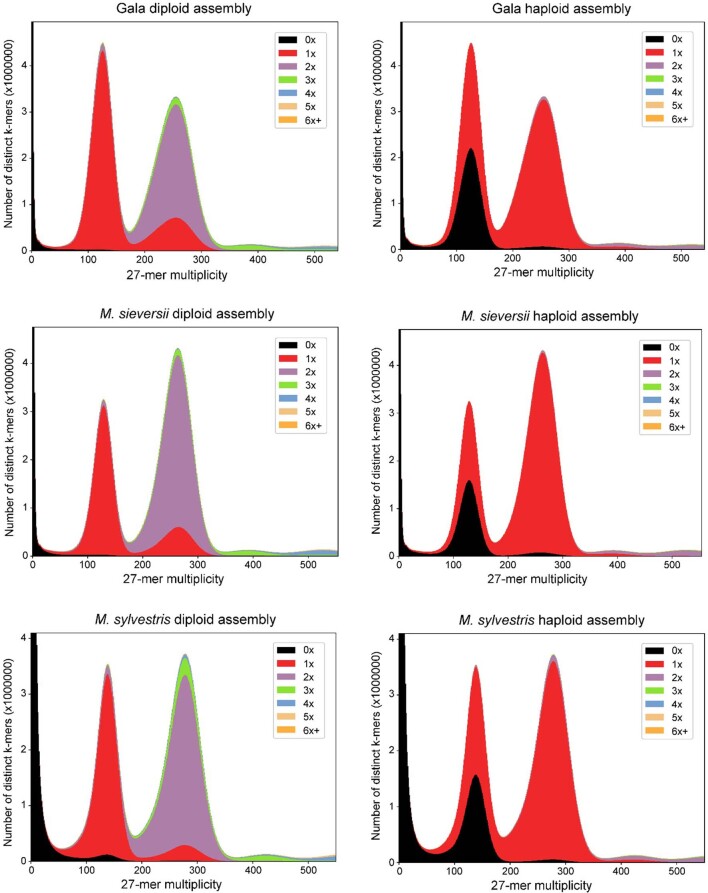
Extended Data Fig. 1. K-mer spectrum analysis.
Comparison of 27-mer spectra between all paired-end reads (y-axis) and assemblies (x-axis) for the three apple accessions. Colors mark different copies of 27-mers in the genome assembly. The black area measures the proportion of 27-mers that were present in the sequencing reads but missing in the assemblies, which could be sequencing errors and contaminated sequences from organelles and microorganisms. The presence of a small portion of single-copy k-mer showing homozygous peak in the diploid assemblies could be due to: 1) the two alleles are nearly identical and were collapsed into one copy in the diploid assembly; and 2) the phased diploid assemblies are incomplete, with only one allele assembled for some loci.

