
Figure 1.
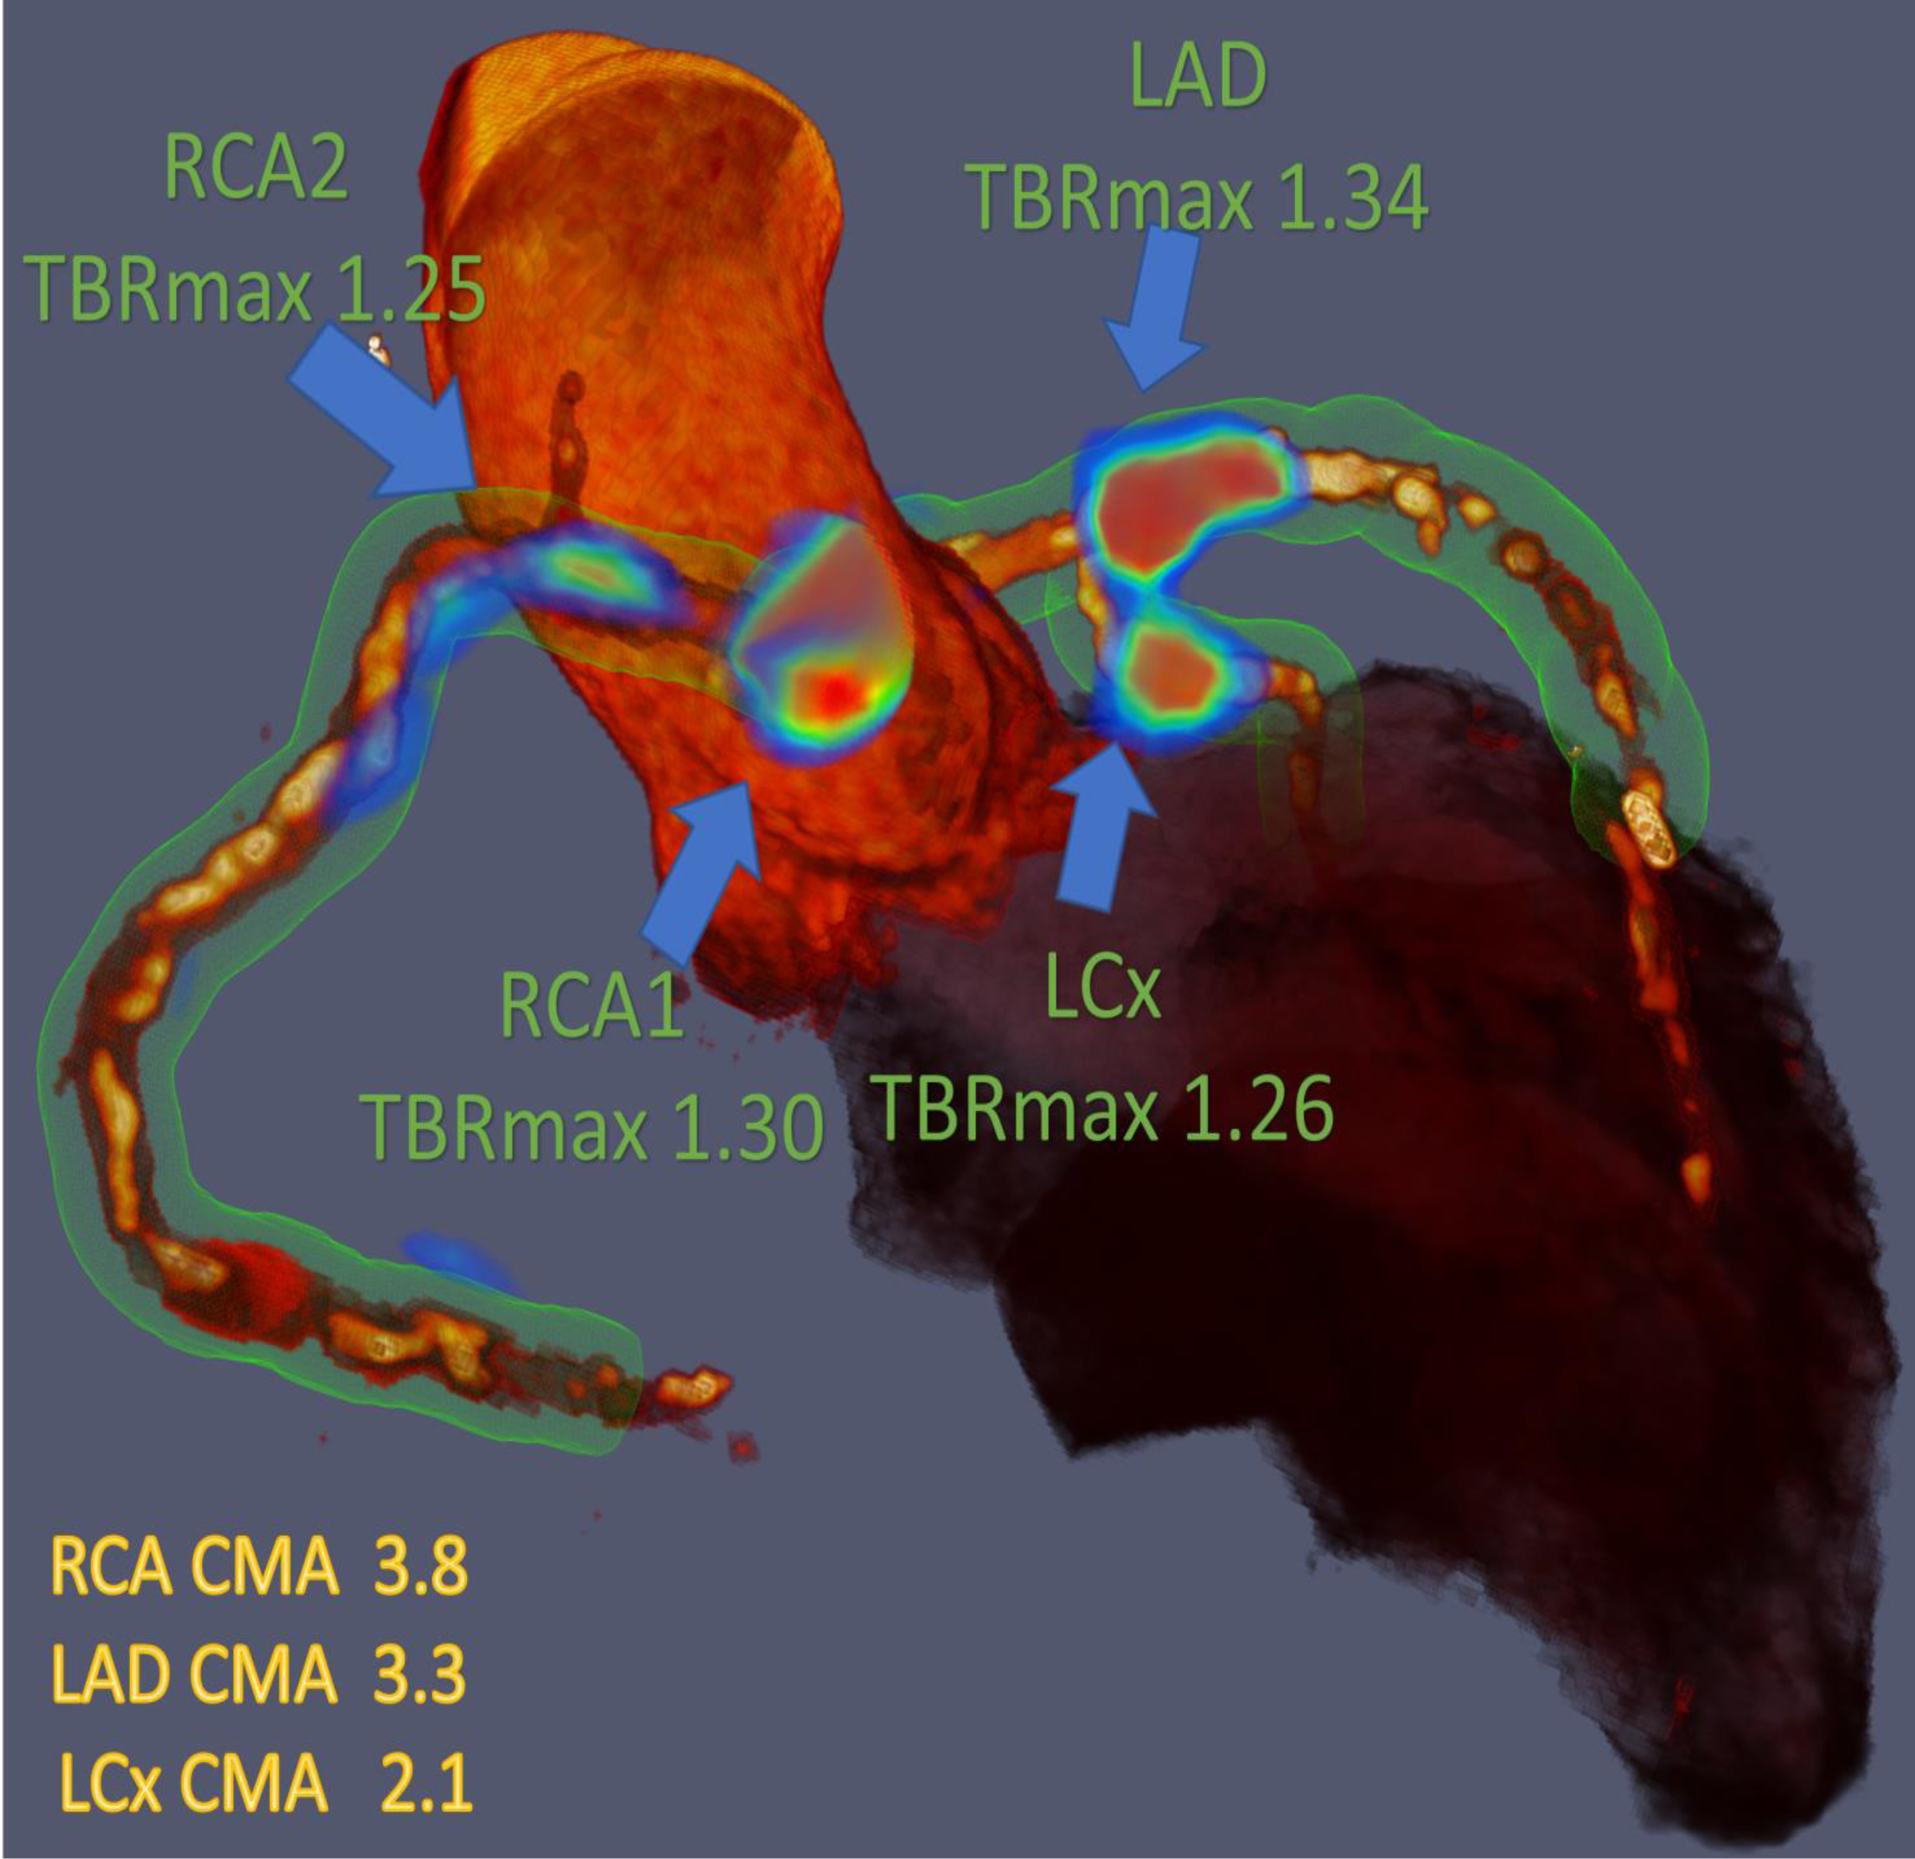
Three-dimensional rendering of coronary computed tomography (CT) angiography with superimposed tubular whole vessel volumes of interest (light green) employed for evaluation of 18F-sodium fluoride (18F-NaF) positron emission tomography (PET) uptake (blue and red). Despite the relatively low maximum tissue-to-background ratio (TBRMAX) due to multiple foci of increased 18F-NaF activity, the coronary microcalcification activity (CMA) in the right coronary artery (RCA) is higher than in the left anterior descending (LAD) coronary artery which presented with a higher TBRMAX (LCx= Left circumflex artery).